
Figures & data
Figure 1 Flowchart of the study participants.
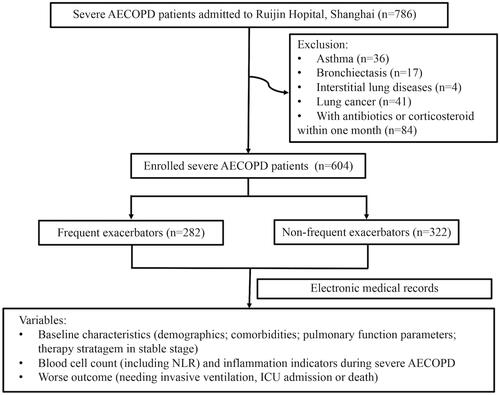
Table 1 Characteristics of Frequent Exacerbators and Non-Frequent Exacerbators During Severe AECOPD
Table 2 Characteristics of Frequent Exacerbators with Different Outcome During Severe AECOPD
Figure 2 (A) NLR during severe AECOPD in frequent exacerbators with different outcome. Among the frequent exacerbators, the values of NLR in the ones with worse outcome were higher than in those without worse outcomes. (B) ROC curve of NLR for predicting the worse outcome of severe AECOPD in frequent exacerbators. The cut-off value of NLR was 10.23, with a sensitivity of 0.621, a specificity of 0.920 and an AUC of 0.833 (95% CI 0.771 −0.894; p<0.001).
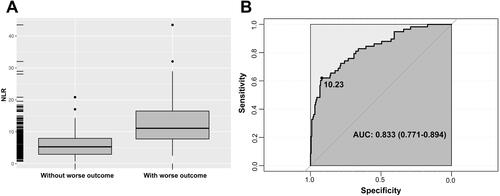
Table 3 Association Between NLR and Worse Outcome in Frequent Exacerbators During Severe AECOPD