Figures & data
Table 1 Characteristics of Patients and the Visits in the Cohort
Figure 1 Trends in the proportion of patients filling at least one prescription (A) and average dose-adjusted number of canisters (B) for major COPD inhaled therapies, during disease course.
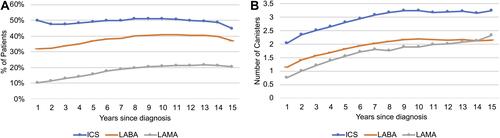
Figure 2 Trends in the proportion of patients on combination therapies (A) and average medication possession ratio (B) over the time course of COPD.
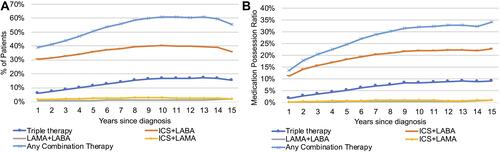
Figure 3 Frequency of long-acting inhaled medication prescription in frequent (dark bars) and non-frequent (light bars) exacerbators.
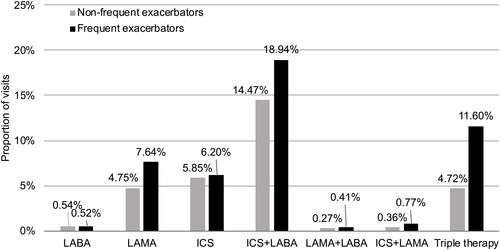
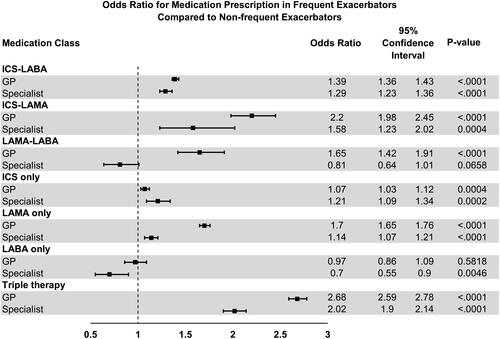
Figure 4 Forest plot of odds ratio (OR) and 95% confidence interval between frequent-exacerbator status and filled prescriptions for each medication type, separately for GP and specialist compared to non-frequent exacerbators.