Figures & data
Figure 1 Study design, showing the observation and index periods for the main cohort of all LABD users (A); the sub-cohort of new LABD users (B); and the additional analysis of yearly rates of LABD initiation (C).
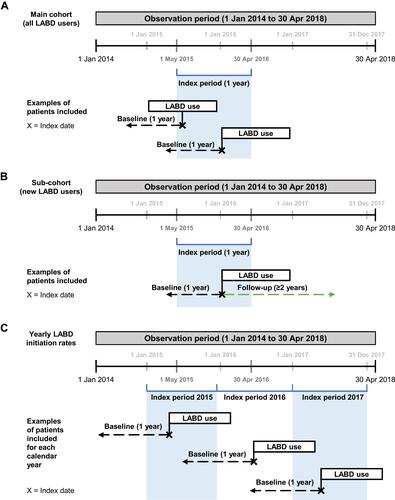
Table 1 Baseline Characteristics of All LABD Users, Stratified by Type of LABD Treatment
Figure 2 Patient disposition for all LABD users.
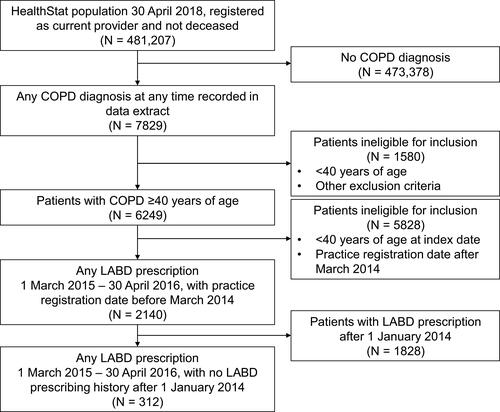
Figure 3 LABD treatment for all LABD users, stratified by patient age at index (A) and ethnicity (B).
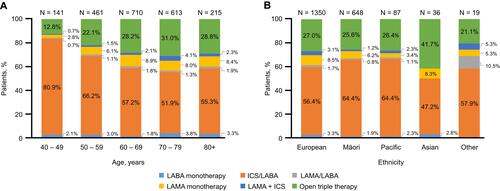
Figure 4 Patient exacerbation history at index for all LABD users, stratified by type of LABD treatment.
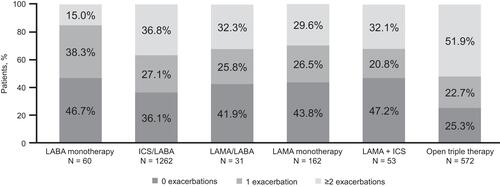
Table 2 Baseline Characteristics of New LABD Users, Stratified by Type of LABD Treatment
Figure 5 LABD treatment in new LABD users, stratified by patient age at index.
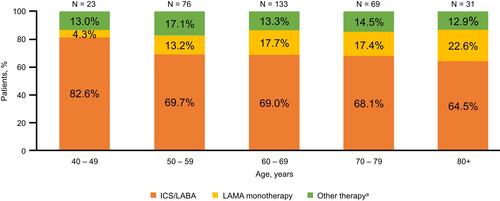
Table 3 Time to and Type of Treatment Modifications Over 12 and 24 Months in New LABD Users
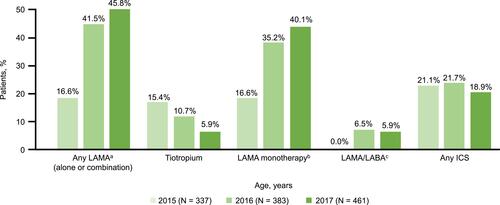
Figure 6 Yearly rates of LABD initiation from 2015 to 2017.