
Figures & data
Figure 1 Study design.
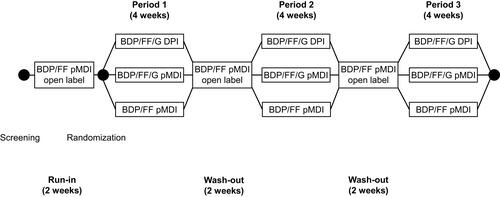
Table 1 Baseline Demographics and Disease Characteristics
Figure 2 FEV1 AUC0–12h and trough FEV1 on Day 28 (co-primary endpoints): (A) Change from baseline (ITT population), and (B) treatment contrasts.
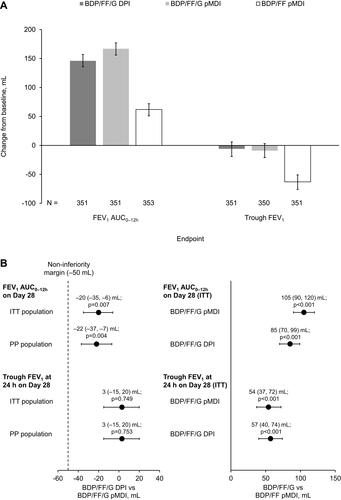
Figure 3 Pre-dose morning FEV1 and FEV1 AUC0–4h on Day 28, and FEV1 AUC0–12h on Day 1 (ITT population).
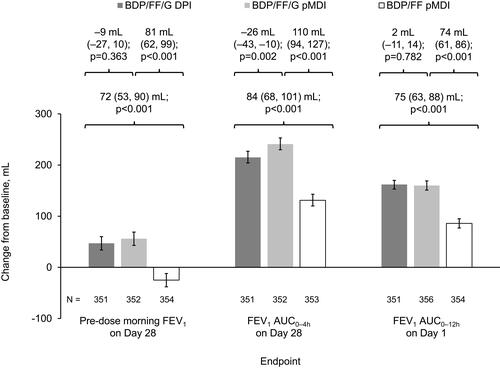
Figure 4 Peak FEV1 assessed up to 12 h post-dose on Days 1 and 28 (ITT population).
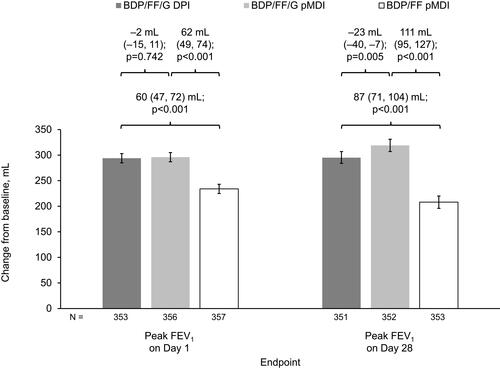
Table 2 Rescue Medication Use (ITT Population)
Figure 5 SGRQ total and domain scores on Day 28 (ITT population).
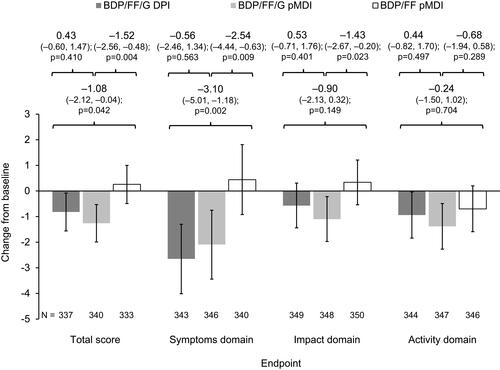
Table 3 Adverse Events, Overall and Most Common Preferred Terms (≥1% of Patients with Any Treatment for Adverse Events; ≥2 Patients in Any Group for Drug-Related Adverse Events, Serious Adverse Events, and Severe Adverse Events)