Figures & data
Table 1 Baseline Patient Characteristics and Demographics
Figure 1 Distribution and range of spirometric PIF values at screening in studies 207608/207609 and in KPNW. *Spirometric PIF 50 L/min, estimated to be equivalent to an ELLIPTA PIF of ≥30 L/min; †Spirometric PIF 102 L/min, which was the recorded spirometric value in the patient with the lowest recorded ELLIPTA PIF (43.5 L/min) in the RES113817/RES117178 studies (two-strip configuration). Estimation of ELLIPTA PIF is based on the equation derived from the RES113817/RES117178 studies, where estimations of below 43.5 L/min are based on extrapolation from spirometric PIF values below the observed minimum of 83.4 L/min. Extrapolating to 50 L/min spirometric PIF, there is 95% confidence that 90% of the population has at least 30 L/min ELLIPTA PIF (lower tolerance bound).
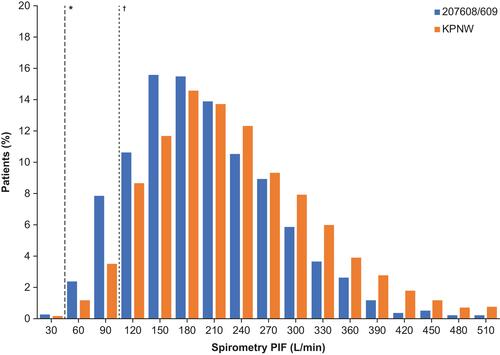
Figure 2 Relationship between spirometric PIF and post-bronchodilator percent predicted FEV1 at screening in pooled 207608/207609 population.
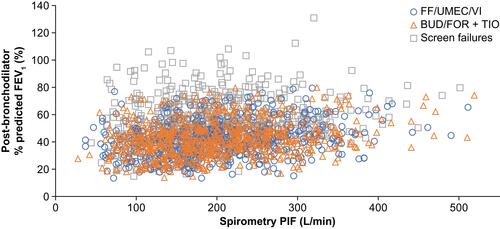
Table 2 Interactions Between Spirometric PIF at Screening and Treatment for Lung Function Endpoints in 207608/207609 Studies
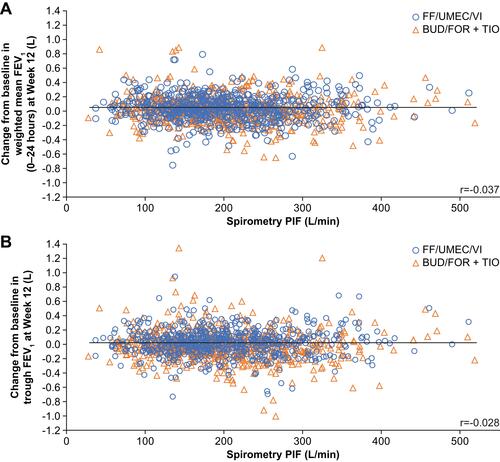
Figure 3 Relationship between spirometric PIF at screening and lung function outcomes in pooled 207608/207609 population. (A) Change from baseline in weighted mean FEV1 at Week 12 and (B) trough FEV1 at week 12.