Figures & data
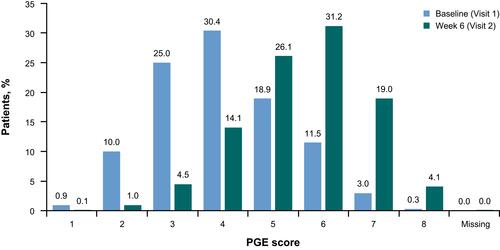
Figure 1 Patient disposition.
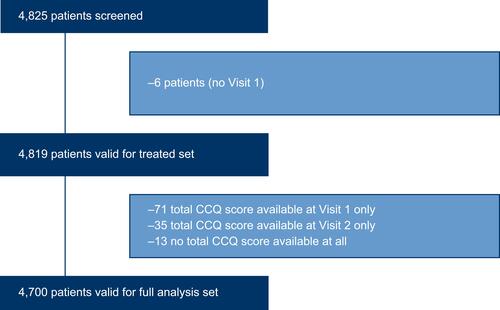
Table 1 Patient Demographics and Baseline Characteristics
Figure 2 Proportion of patients achieving therapeutic success at Week 6, all patients and stratified by treatment pathway (full analysis set). Error bars are 95% CI. Therapeutic success was defined as a 0.4-point decrease in CCQ score between baseline and after 6 weeks of treatment. Based on prior findings,Citation23 a change of 0.4 points was considered to be the minimum clinically important difference for the total CCQ score. Due to the low number of patients who switched from pre-existing treatments to a combination of tiotropium/olodaterol plus a separate ICS, this group was excluded from the subgroup analysis. Patients on other prior therapies were also excluded.
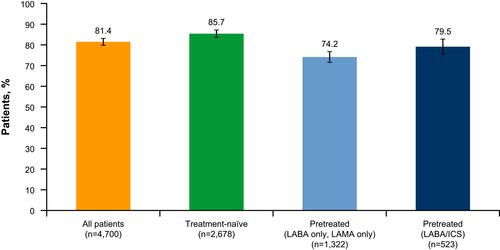
Figure 3 Absolute reductions in CCQ scores between Visits 1 and 2 for symptom, functional state, mental state and total CCQ score, all patients (full analysis set). Total CCQ score, a measurement of overall health and functional status, was provided by the sum of the scores divided by 10, with a higher CCQ score indicative of worse status. The functional state score was derived from the sum of CCQ questions 7, 8, 9 and 10, divided by 4; the symptom score from the sum of CCQ questions 1, 2, 5 and 6, divided by 4; and the mental state score was derived from the sum of CCQ questions 3 and 4, divided by 2.
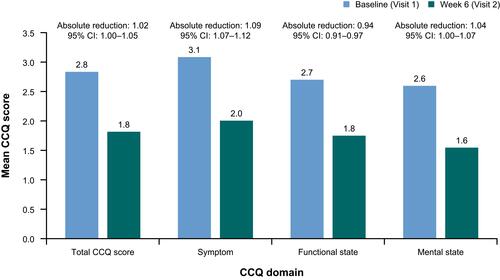
Figure 4 Change in general condition of the patient, evaluated using the PGE, between baseline and Week 6, all patients (full analysis set). 1–2 = poor, 3–4 = satisfactory, 5–6 = good, 7–8 = excellent.