Figures & data
Figure 1 Flowchart of study cohort selection.
Notes: Inclusion criteria were codes of ICD-9-CM 491–492, 496 three times or more, and were >40 years old; patients who had received statins or had been diagnosed with COPD before 2000 were excluded; the remaining patients were divided into four groups (with or without corticosteroids usage and concomitant use or non-use of statins) to analyze.
Abbreviations: COPD, chronic obstructive pulmonary disease; ED, emergency department.
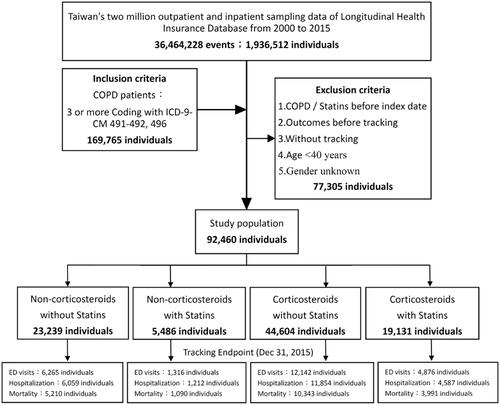
Table 1 Characteristics of Study in the Baseline
Table 2 Rate of Outcomes and Stratified by Sex
Figure 2 Forest plot of analysis by propensity score matching 1:1.
Note: ◆ means statistically significant (p values < 0.05) and ● means not.
Abbreviations: ED visits, emergency department visits; aHR, adjusted hazard ratio: adjusted for the variables listed in the Table S2; CI, confidence interval.
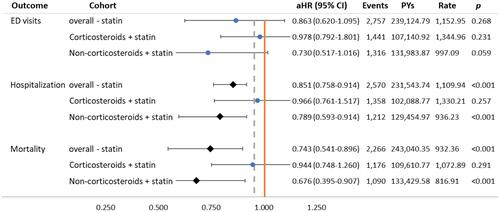
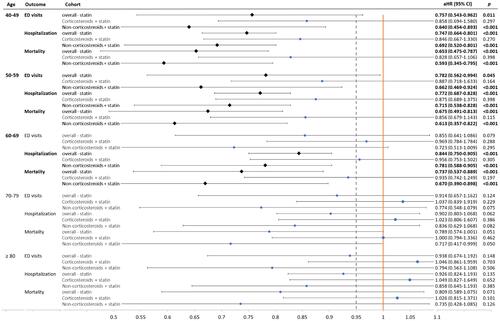
Figure 3 Forest plot of age-stratified.
Notes: ◆ and boldface of the word mean statistically significant (p values < 0.05); ● means not statistically significant.
Abbreviations: ED visits, emergency department visits; aHR, adjusted hazard ratio: adjusted for the variables listed in the Table S2; CI, confidence interval.