
Figures & data
Figure 1 Flow chart showing the literature search and selection. Specific reasons for exclusion of studies are also shown.
Abbreviation: COPD, chronic obstructive pulmonary disease.
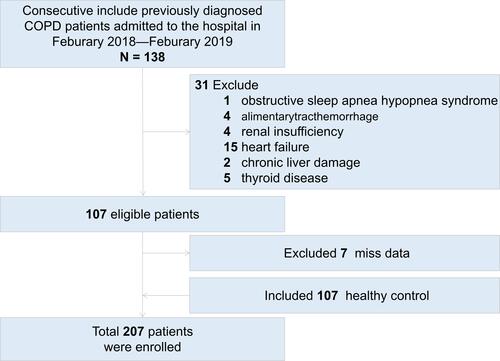
Table 1 Comparison of COPD Patients and Healthy Controls
Table 2 T-Tests for Groups Divided According to RCI with Severity of Disease and Other Functions
Figure 2 Correlations of the RCI, NLR and PLR with FEV1%.
Notes: Correlations between RCI, NLR and PLR levels in COPD patients and FEV1% were assessed by Pearson’s correlation test, RCI, r = −0.302, p = 0.004; NLR, r = −0.153, p = 0.148; and PLR, r = −0.098, p = 0.354.
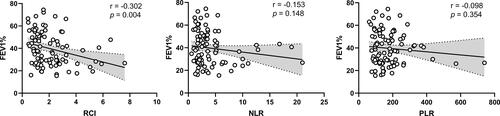
Figure 3 ROC curves of the RCI, NLR, PLR, Lym and RDW of COPD patients, for predicting severe or mild COPD. The area under ROC curve of RCI: 0.729; 95% CI: 0.619–0.839; p = 0.001.
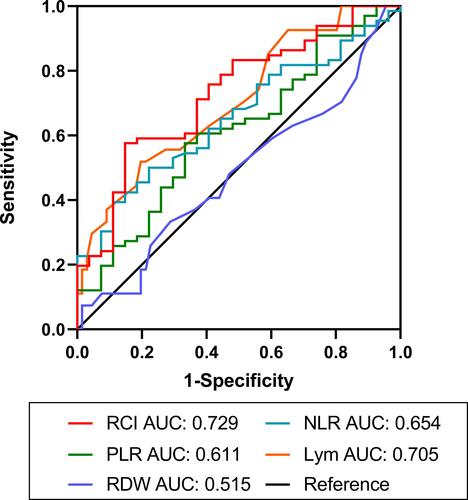
Table 3 Univariate Logistic Regression Analysis Assesses Different Prognostic Predictors of COPD
Table 4 Adjusted Odds Ratio (95% Confidence Interval) for Severe COPD (GOLD III + IV)