Figures & data
Figure 1 Flowchart of recruitment strategies and numbers of responding pulmonologists (A) and general practitioners (B).
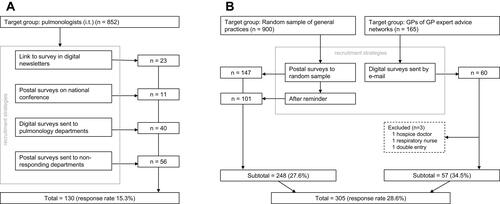
Table 1 Characteristics of participating pulmonologists and general practitioners
Figure 2 Methods used by pulmonologists and general practitioners to identify the palliative phase in patients with COPD. *Significant difference (p < 0.05 using Chi-square test).
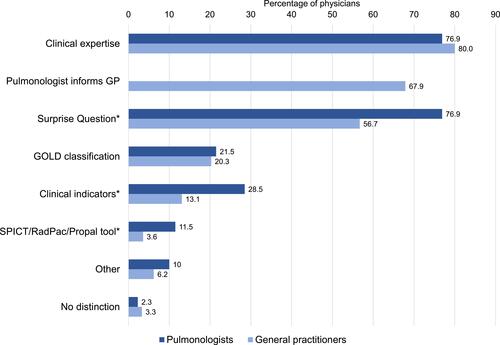
Table 2 Symptom management in patients with COPD in the palliative phase that respondents had treated in the previous year, and comparison of pulmonologists and general practitioners
Table 3 Frequency of topics discussed by respondents in the previous year, and comparison of pulmonologists and general practitioners
Figure 3 Collaboration with healthcare providers by pulmonologists and general practitioners. Percentages of physicians with answer often or always. *Significant difference (p < 0.05 using Mann–Whitney U-test).
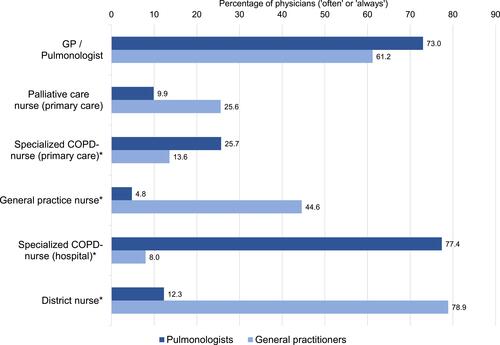
Figure 4 Referral to healthcare providers by pulmonologists and general practitioners. Percentages of physicians with answer often or always. *Significant difference (p < 0.05 using Mann–Whitney U-test).
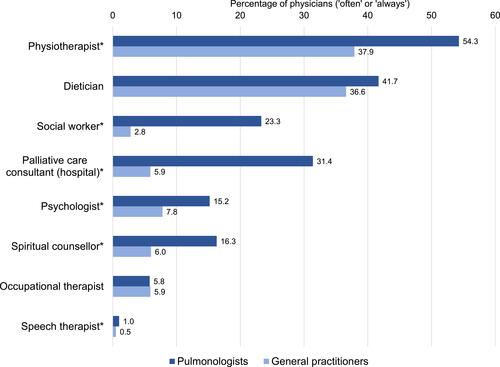
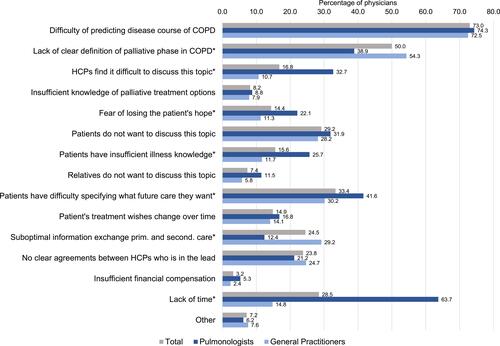
Figure 5 Barriers of palliative care discussions with patients with COPD, as indicated by pulmonologists, general practitioners and all respondents. *Significant difference between pulmonologists and GPs (p < 0.05 using Chi-square test).