Figures & data
Figure 1 Participant flow diagram.
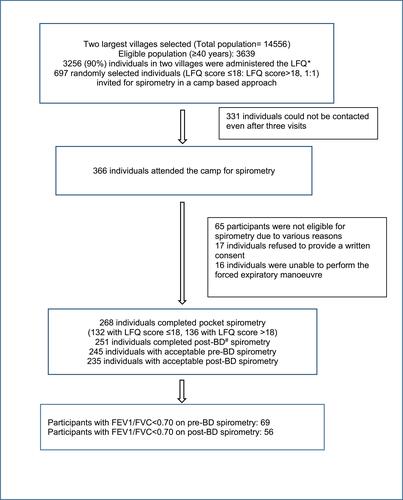
Table 1 Comparison of Demographic Characteristics of the Study Participants (N=3256)
Table 2 Comparison of Lung Function Parameters (FEV1 and FEV6) of Participants Obtained from the Three Best Forced Expiratory Manoeuvres on the Pocket Spirometer
Table 3 Diagnostic Performance of the Lung Function Questionnaire (LFQ), Pocket Spirometry (PS) and the Combined Strategy (LFQ Followed by the PS) Compared to the Post-Bronchodilation Spirometry (n=235)
Table 4 Comparison of Lung Function Parameters FEV1, FEV6 or FVC(L) as Measured by Pocket Spirometry, Pre-Bronchodilation and Post-Bronchodilation Gold Standard Spirometry
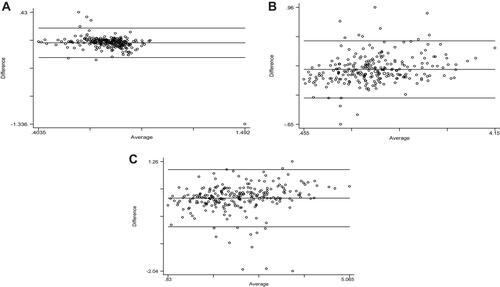
Figure 2 Bland-Altman plots comparing lung function parameters between pocket spirometry and pre-bronchodilator spirometry. (A) Bland-Altman plot comparing FEV1/FEV6 ratio obtained from pocket spirometry with that FEV1/FVC ratio of pre-bronchodilator spirometry (B) Bland-Altman plot comparing FEV1 obtained from pocket spirometry with that of pre-bronchodilator spirometry. (C) Bland-Altman plot comparing FEV6 obtained from pocket spirometry with that of FVC obtained from pre-bronchodilator spirometry.