
Figures & data
Figure 1 GOLDEN 3 and 4 study designs.
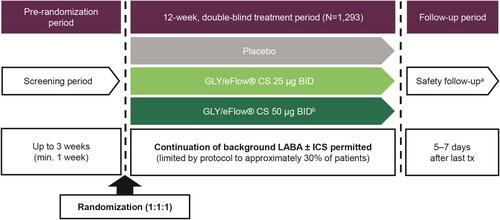
Table 1 Patient Distribution by Baseline Comorbid Anxiety and Depression Status
Table 2 Patient Demographics and Baseline Characteristics by Baseline Comorbid Anxiety and Depression Status
Figure 2 Pooled analysis of change from baseline in trough FEV1 at 12 weeks, by baseline comorbid anxiety and depression status (ITT population).
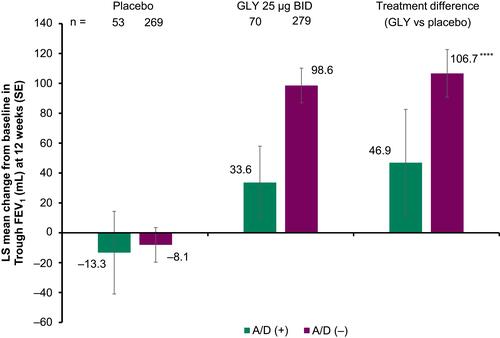
Figure 3 Pooled analysis of SGRQ change from baseline in (A) total score, (B) activity score, (C) impacts score, and (D) symptoms score at 12 weeks, by baseline comorbid anxiety and depression status (ITT population).
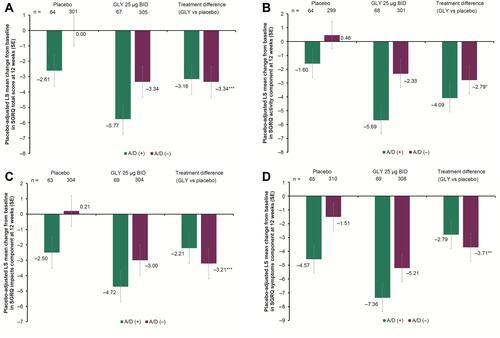
Figure 4 SGRQ responder rates at 12 weeks, by baseline comorbid anxiety and depression status (ITT population).
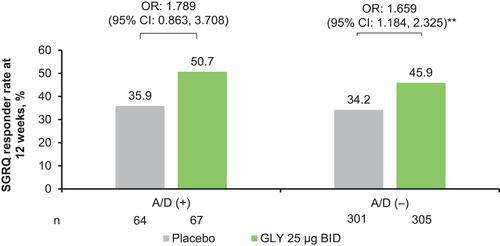
Table 3 Summary of AEs and SAEs, Including Individual AEs with Incidence ≥5% in Any Treatment Group, by Baseline Comorbid Anxiety and Depression Status (Safety Population)