Figures & data

Table 1 Patient Demographics and Clinical Characteristics at Baseline
Figure 1 Reduction in annual rate of exacerbations. aNumbers indicate number of exacerbations experienced in each group.
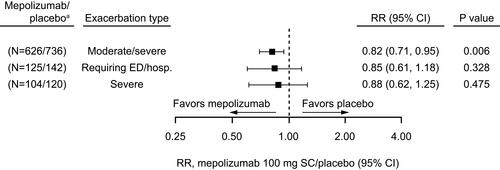
Figure 2 Kaplan−Meier curve of (A) time to first moderate/severe exacerbation and (B) time to first exacerbation leading to ED visit/hospitalization. Vertical bars represent 95% CIs.
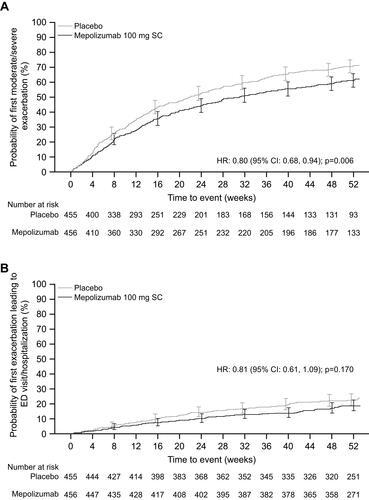
Figure 3 Change from baseline for (A) SGRQ total score and (B) CAT score, and (C) proportion of SGRQ respondersa and (D) CAT respondersb. In panels A and B, the vertical bars represent 95% CIs. aSGRQ responders are defined as patients achieving ≥4-point reduction in total score; bCAT responders are defined as patients achieving a ≥2-point decrease from baseline.
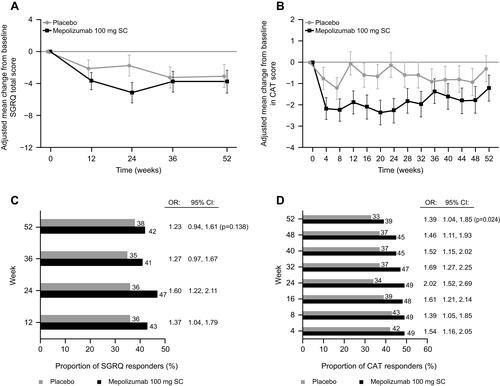
Figure 4 Stratification (non-mutually exclusive) by screening blood eosinophil count thresholds of annual rates of (A) moderate/severe exacerbations, (B) exacerbations leading to ED visit/hospitalization and (C) severe exacerbations at Week 52. Mepolizumab/placebo N numbers refer to the total patient numbers fulfilling the blood eosinophil count threshold criteria in the mepolizumab and placebo groups, respectively; one patient from the mepolizumab 100 mg and one patient from the placebo group did not have a screening eosinophil count available. aCI extends beyond the x-axis range.
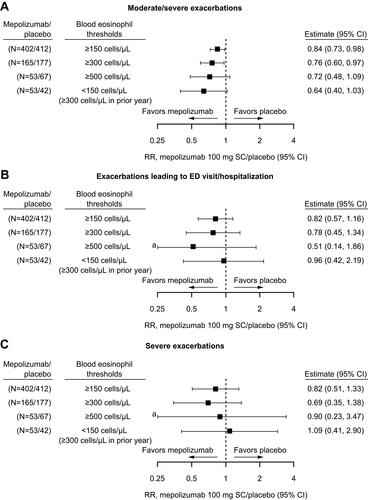
Figure 5 Week 52 change from baseline versus placebo for (A) SGRQ total score, (B) SGRQ responders, (C) CAT score, and (D) CAT responders by blood eosinophil count thresholds (non-mutually exclusive). Mepolizumab/placebo N numbers refer to the total patient numbers fulfilling the blood eosinophil count threshold criteria in the mepolizumab and placebo groups, respectively; one patient from the mepolizumab 100 mg and one patient from the placebo group did not have a screening eosinophil count available; includes patients with endpoint measurements at baseline and Week 52. Panels B and D: patients with no endpoint measurement at Week 52 included as non-responders. aSGRQ responders are defined by ≥4-point reduction in SGRQ total score; bCAT responders are defined by ≥2-point reduction in the CAT score; cCI extends beyond the x-axis range.
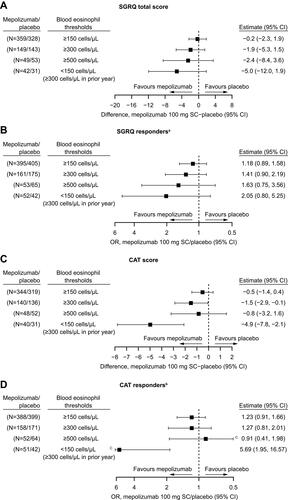
Figure 6 Predicted (A) annual rates and (B) treatment RR of all moderate/severe exacerbations by screening blood eosinophil count for patients receiving mepolizumab 100 mg SC or placebo (modelling analysis). Shaded areas represent 95% CIs for predicted rates and RRs; For (B), arrows represent events/year and RR at a screening eosinophil count threshold.
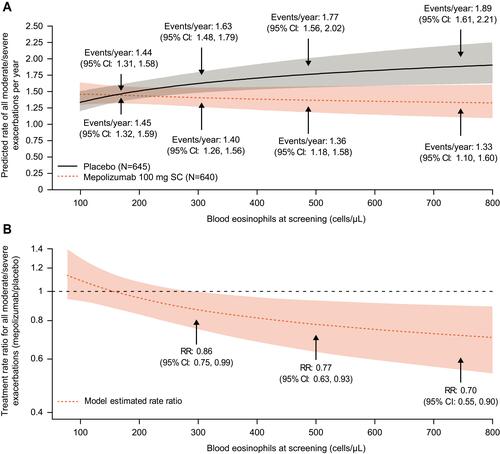
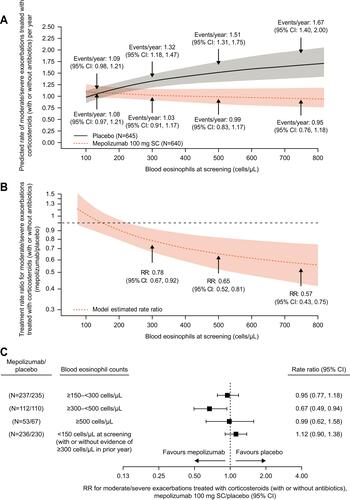
Figure 7 Predicted (A) annual rates and (B) RR of moderate/severe exacerbations treated with corticosteroids (with and without antibiotics) by screening blood eosinophil count (modelling analysis); (C) stratification (mutually exclusive) by screening blood eosinophil count categories of annual rates of moderate/severe exacerbations requiring antibiotics (with and without OCS). Shaded area represents 95% CIs for predicted rates and RRs; arrows represent events/year and RR at a screening eosinophil count threshold. Panel C: two patients from the mepolizumab 100 mg and three patients from the placebo group did not have a screening eosinophil count available.