
Figures & data
Figure 1 Study design.
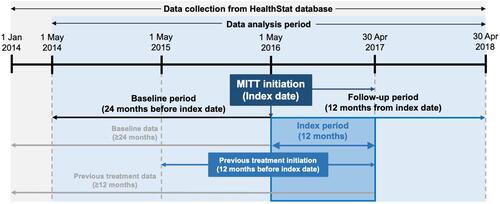
Table 1 Definitions of Treatments for COPD That Were Recorded Across the Study Period (1 January 2014 to 30 April 2018)
Figure 2 Diagram showing the calculation of MPR.
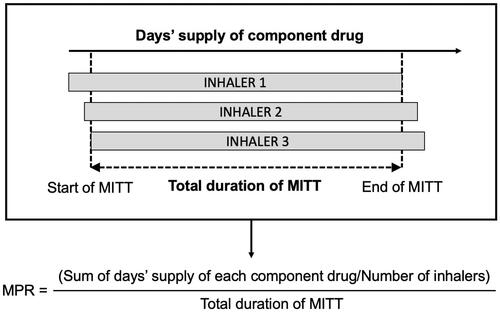
Figure 3 PDC definition when considering overlap of all three triple therapy components (A); and when considering each triple therapy component separately (B).
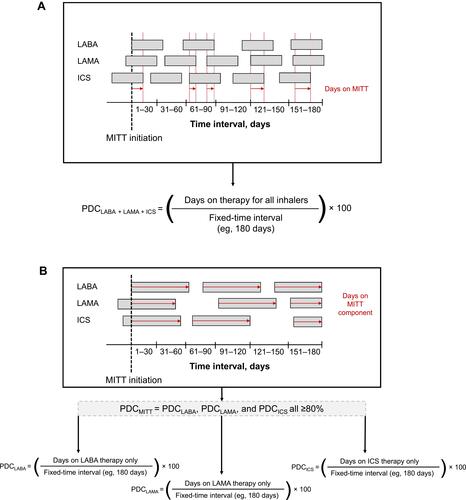
Figure 4 Flow chart of patient disposition.
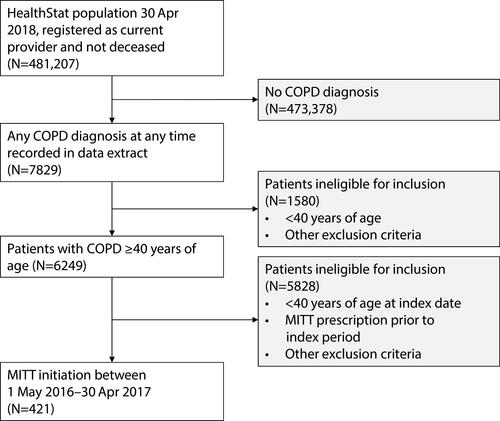
Table 2 Baseline Demographics and Clinical Characteristics of Patients with COPD Who Initiated MITT Between 1 May 2016 and 30 April 2017
Table 3 Treatment Class and Median Treatment Duration in 12 Months Prior to MITT Initiation
Table 4 Treatment Patterns Among Patients with COPD Who Initiated MITT Between 1 May 2016 and 30 April 2017
Table 5 Persistence and Adherence for Patients with COPD Who Initiated MITT Between 1 May 2016 and 30 April 2017