Figures & data
Table 1 Demographic and Lung Function Data
Table 2 Sequence for Transfection
Table 3 Primers for qRT-PCR
Figure 1 Pulmonary arterial remodeling was evidenced in smokers, with a higher severity in smokers with COPD. (A) Histology of lung tissues from non-smokers and smokers with or without COPD were observed via Van Gieson (VG) staining, at 40× magnification. (B) Histology of lung tissues from non-smokers and smokers with or without COPD were observed via Hematoxylin–eosin (H&E) staining, at 100× magnification. (C) Histology of lung tissues of the alveolus from non-smokers and smokers with or without COPD were observed via VG staining, at 200× magnification. Arrows pointed to thicker intimae and larger lumens.
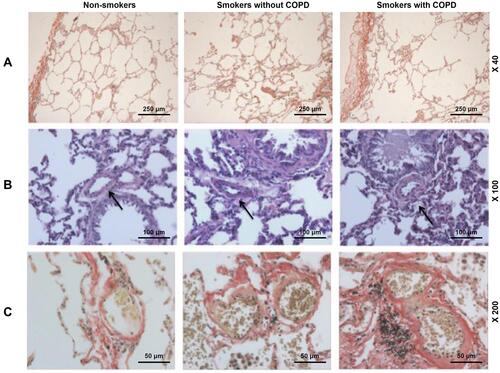
Figure 2 Pulmonary vascular endothelial apoptosis and higher TNF expression were observed in smokers, with a higher severity in smokers with COPD. (A) Representative TUNEL staining images of lung tissues from non-smokers and smokers with or without COPD at 200× magnification. (B) Immunohistochemistry analysis of TNF-α in lung tissue from non-smokers and smokers with or without COPD. (C and E) Immunofluorescence analysis of TNF-α from non-smokers and smokers with or without COPD. (D) Apoptosis rate of lung tissues from non-smokers and smokers with or without COPD was quantified. Black and white arrows were all positive cells. All experiments were performed in triplicate and experimental data were expressed as mean ± standard errors (SE). *P<0.05, vs Non-smokers.
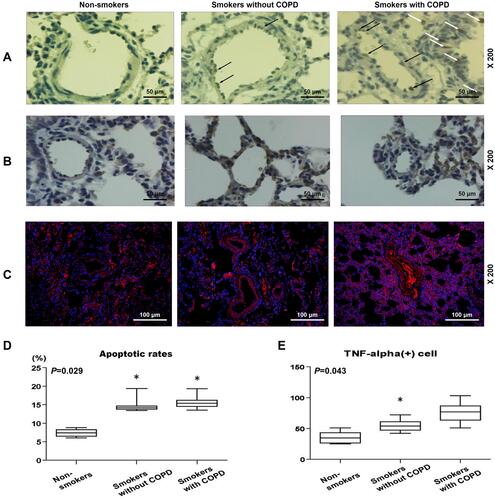
Table 4 Correlation Analysis Between the Percentage of Medial Wall Thickness, Lung Function, Apoptosis Index, TNF(+) Cell and Smoke Index
Figure 3 Correlation analysis of lung function, apoptosis rates, TNF-α+ cells and smoke index. (A) A positive correlation between smoke index and apoptosis rates in smokers with or without COPD. (B) A negative correlation between apoptosis rates and FEV1/FVC in smokers with or without COPD. (C) A positive correlation between smoke index and TNF-α+ cells in smokers with or without COPD.
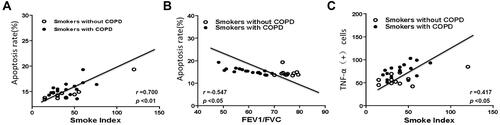
Figure 4 Etanercept reversed the effects of CSE on promoting HPAEC apoptosis. (Aand B) Hoechst 33342 staining was used for detecting HPAEC apoptosis after CSE exposure and ETN treatment. White arrows were apoptotic cells. A set of plots of a representative experiment was presented in panel. (C and D) HPAEC apoptosis was detected by flow cytometry after CSE exposure and etanercept treatment. All experiments were performed in triplicate and experimental data were expressed as mean ± standard errors (SE). *P<0.05, vs etanercept 0 mg/L, with 5% CSE for 12 h.
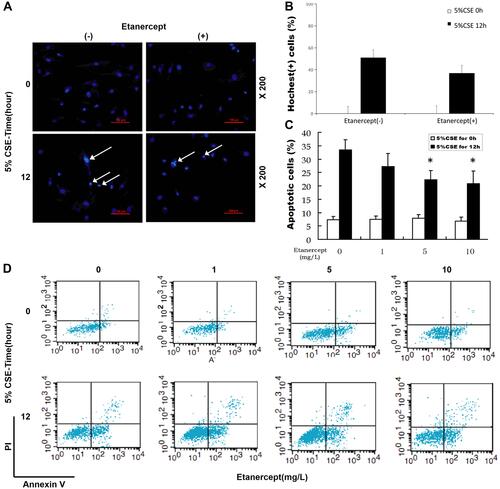
Figure 5 Etanercept attenuated the apoptosis of CSE-induced HPAECs via regulating levels of cell apoptosis-related caspases. (A) Protein expressions of cleaved caspase-3, cleaved caspase-8, and cleaved caspase-9 after CSE exposure and ETN treatment were measured by Western blot. β-Actin was used as the internal control. (B–D) Ratios of cleaved-caspase-3/procaspase-3 (B), cleaved-caspase-8/procaspase-8 (C), and cleaved-caspase-9/procaspase-9 (D) were determined. All experiments were performed in triplicate and experimental data were expressed as mean ± standard errors (SE). *P<0.05, vs control; #P<0.05, vs CSE.
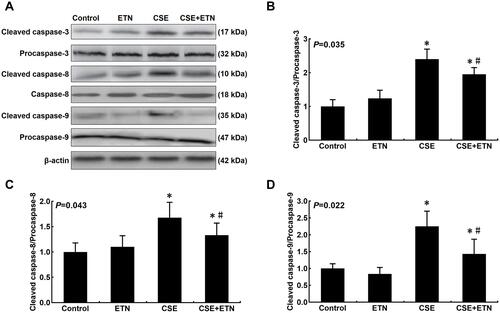
Figure 6 Etanercept attenuated the apoptosis of CSE-induced HPAECs via regulating levels of cell apoptosis-related proteins. (A–F) Protein levels of Bax (C), Bcl-2 (D), FasL (E) and Fas (F) after CSE exposure and ETN treatment were measured by Western blot. β-Actin was used as the internal control. All experiments were performed in triplicate and experimental data were expressed as mean ± standard errors (SE). *P<0.05, vs control; #P<0.05, vs CSE.
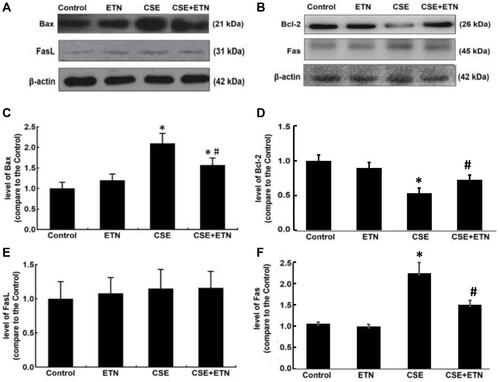
Figure 7 Etanercept reversed the effects of CSE on levels of inflammatory cytokines, TNFR1, p-p65/ p65 in HPAECs. (A and C) Levels of inflammatory cytokines TNF-α (A), IL-6 (B) and IL-8 (C) in HPAECs after CSE exposure and ETN treatment were quantified using enzyme-linked immunosorbent assay (ELISA). (D–F) Protein/β-actin expressions of TNFR1, p65 and p-p65 in HPAECs after CSE exposure and ETN treatment were determined using Western blot. β-Actin was used as the internal control. All experiments were performed in triplicate and experimental data were expressed as mean ± standard errors (SE). *P<0.05, vs control; #P<0.05, vs CSE.
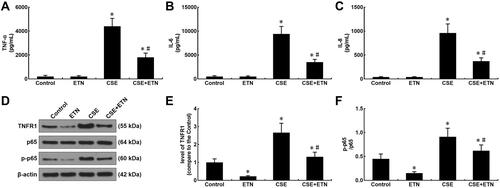
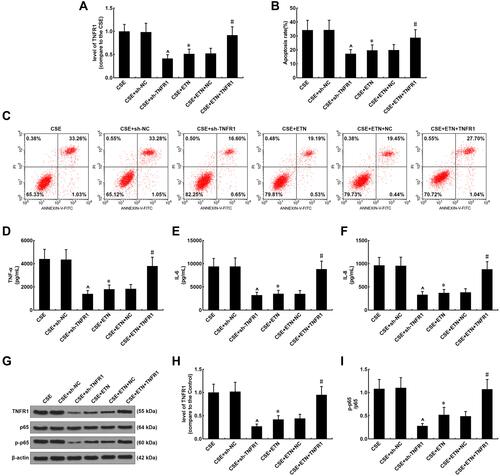
Figure 8 Etanercept alleviated the effects of CSE on TNFR1 expression, suppressed apoptosis and inflammatory cytokine levels in HPAECs, which was reversed by overexpressed TNFR1. (A) Expressions of TNFR1 after CSE exposure, transfection of shTNFR1 and the TNFR1 overexpression plasmid, and ETN treatment were measured using quantitative-real-time polymerase chain reaction (qRT-PCR). β-Actin was used as the internal control. (B and C) Apoptosis rates of HPAECs after CSE exposure, transfection of shTNFR1 and the TNFR1 overexpression plasmid, and ETN treatment were determined by flow cytometry. (D–F) Levels of inflammatory cytokines TNF-α (D), IL-6 (E) and IL-8 (F) in HPAECs after CSE exposure, transfection of shTNFR1 and the TNFR1 overexpression plasmid, and ETN treatment were quantified using ELISA. (G and H) Protein levels of TNFR1, p65 and p-p65 in HPAECs after CSE exposure, transfection of shTNFR1 and the TNFR1 overexpression plasmid, and ETN treatment were determined using Western blot. β-Actin was used as the internal control. (I) Ratios of p-p65/p65 were measured. All experiments were performed in triplicate and experimental data were expressed as mean ± standard errors (SE). *P<0.05, vs CSE; ^P<0.05, vs CSE+sh-NC; #P<0.05, vs CSE+ETN+NC.