Figures & data
Table 1 Patient Demographics and Baseline Characteristics
Table 2 Association Between Patient Demographics and Baseline Characteristics and the Achievement of a CII at Week 4
Figure 1 Proportion of patients achieving a CII at Weeks 12 and 24 stratified by the achievement of a CII at Week 4.
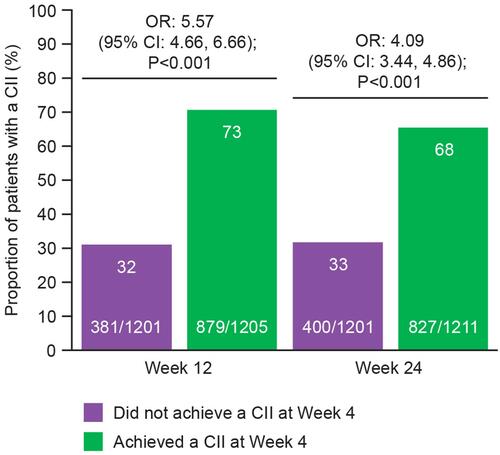
Table 3 Ordered OR of GADS Improvement on the 7-Point Likert Scale at Week 4
Table 4 Combinations of PRO Responses at Week 4 by Treatment
Figure 2 Proportion of patients with a Clinically Important Deterioration (CID)a after Day 30 by: (A) achievement of a CII at Week 4; (B) the number of PRO responses at Week 4; (C) Kaplan–Meier curve of time to first CID in patients by achievement of CII at Week 4.
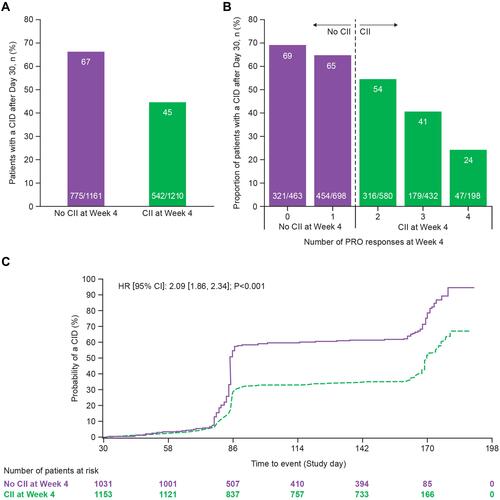
Table 5 Proportion of Patients Who Maintained Their Week 4 CII Status at Week 24
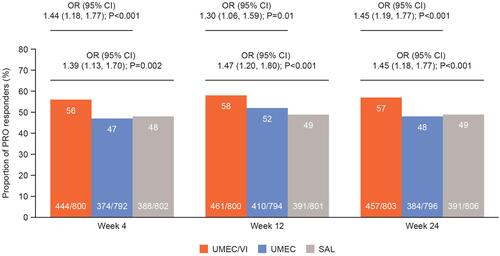
Figure 3 Proportion of patients achieving CII (reaching MCID in at least two PROs) at Weeks 4, 12 and 24a.