Figures & data
Table 1 Anthropometrics, Medical and Pulmonary Function Characteristics
Figure 1 Prevalence of physical frailty criteria in frail and non-frail individuals.
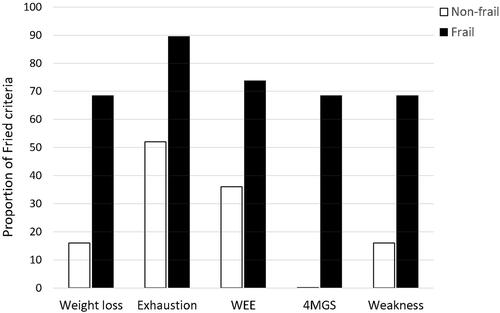
Table 2 Clinical Assessments
Figure 2 Daily physical activity levels defined by the number of steps (A) and the number of time spent in sedentary (B), light (C) and moderate (D) activities in minutes. Values are mean ± SD. *p<0.05 frail versus non-frail. Since neither group spent any time in vigorous activity, this physical activity parameter is not presented.
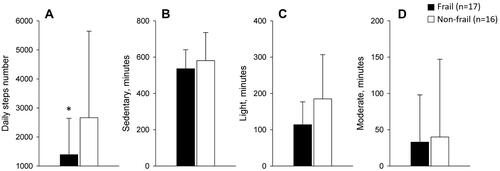
Table 3 Pearson Correlation with Physical Frailty
Figure 3 ROC curves of the SPPB and TUG as predictors of physical frailty.
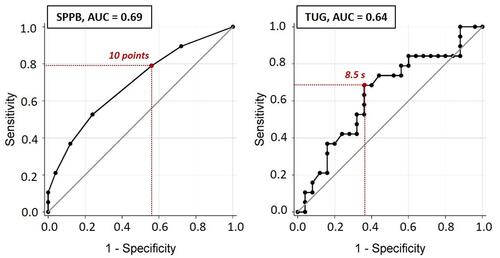
Table 4 Odds Ratio for Detecting Physical Frailty
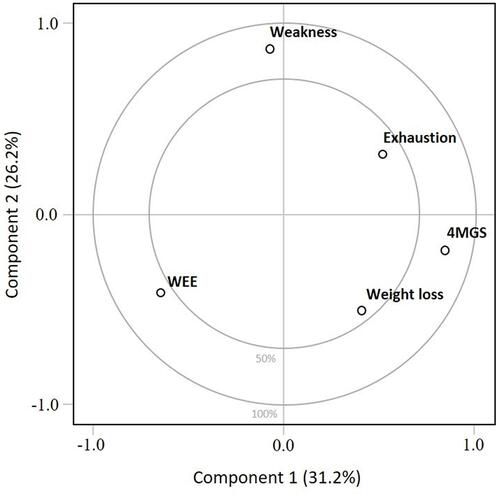
Figure 4 Principal component analysis of the first two principal components of physical frailty. Principal component analysis (PCA) is a simple graphical display used to study the overall structure of the dataset and to obtain a visual understanding of relationships between the included variables (ie, Fried criteria)Citation52. On this graphical representation, the closer a variable is to the external boundary the larger is its contribution to the component. PCA analysis indicated that the first component and the second component explained 31.2% and 26.2% of the variance of the physical frailty score, respectively. On the first component, 4MGS had the highest positive loading, while on the second component, weakness had the highest positive loading. Cumulatively, components 1 and 2 explained 57.4% of the variance of physical frailty score.