Figures & data
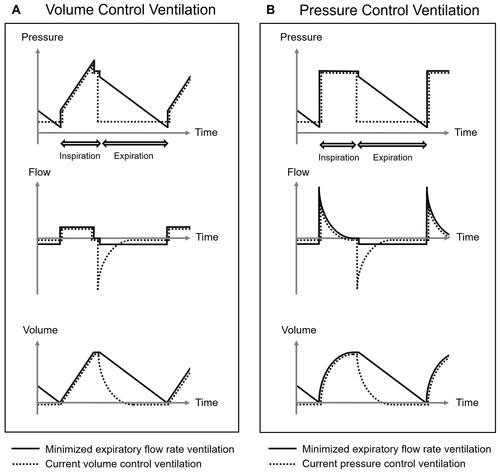
Figure 1 Minimized expiratory flow rate ventilation. The curves of pressure, flow, and volume during a respiratory cycle in the conceptual ventilation mode “minimized expiratory flow rate ventilation” are shown compared with those of current volume control ventilation (A) and pressure control ventilation (B).