Figures & data
Figure 1 Flowchart of study population.
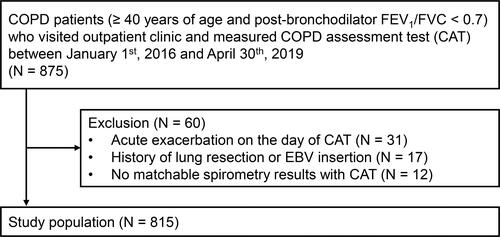
Figure 2 Different increasing pattern of each CAT items according to total CAT score. (A) Pulmonary items (cough, sputum, chest tightness and dyspnea) and (B) Extra-pulmonary items (activities, confidence, sleep and energy).
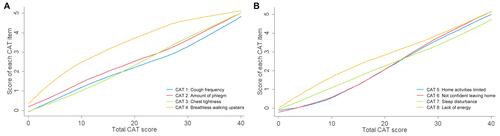
Table 1 Baseline Characteristics of Patients According to Total CAT Score Groups
Table 2 Baseline Pulmonary Function Parameters of Patients According to Total CAT Score Groups
Figure 3 Proportion contribution of four pulmonary items (cough, sputum, chest tightness and dyspnea) and four extra-pulmonary items (activities, confidence, sleep and energy) to the total CAT score, according to impact severity group. *Four patients had zero score in CAT.
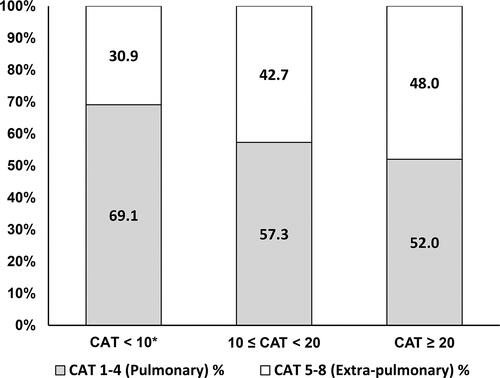
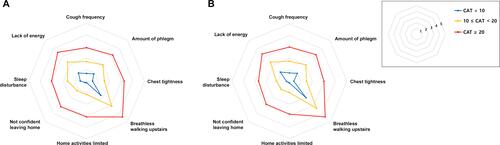
Figure 4 Distribution of mean score for each CAT items according to impact severity group (absolute values are available in supplementary table E1).
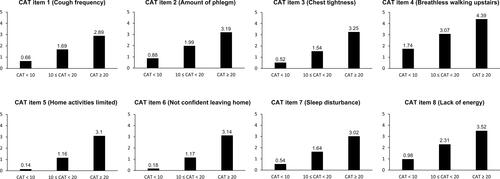
Figure 5 Distribution of mean score for each CAT items according to impact severity group in (A) CLUE registry (the present study, N = 815) and (B) KOCOSS cohort (multicenter cohort for validation, N = 2162).