Figures & data
Table 1 Univariate Logistic Regression Analyses of COPD Influencing Factors
Figure 1 Screening predictors using LASSO binary logistic regression model.
Notes: LASSO coefficient profiles of the 18 features. Find the optimal value using the minimum standard and the minimum standard I-Standard Error method and draw a vertical dotted line.
Abbreviation: LASSO, least absolute shrinkage and selection operator.
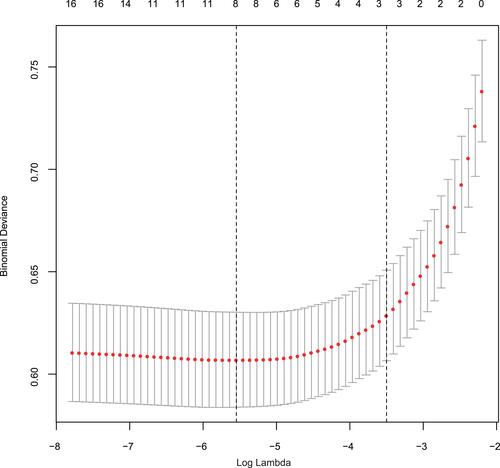
Figure 2 A nomogram to predict the development of COPD.
Notes: The medication nonadherence nomogram was developed, with age, sex, barbeque, smoking, passive smoking, type of energy, ventilation systems, and Post-Bronchodilator FEV1.
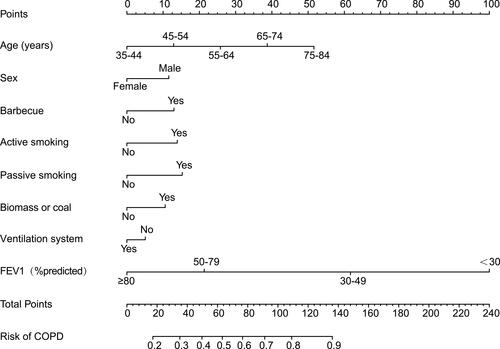
Figure 3 Calibration curve to predict the development of COPD.
Notes: The x-axis represents the predicted COPD risk. The y-axis represents the actual diagnosed COPD. The diagonal dotted line represents a perfect prediction by an ideal model. The solid line represents the performance of the nomogram. The closer the solid line is to the diagonal, the more accurate the prediction.
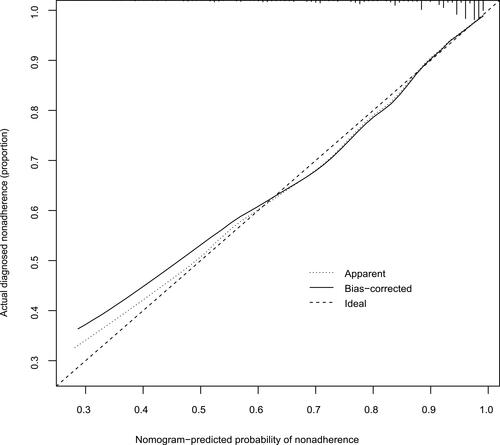
Figure 4 ROC curve to predict the development of COPD.
Abbreviations: ROC, receiver operator characteristics; AUC, area under the curve.
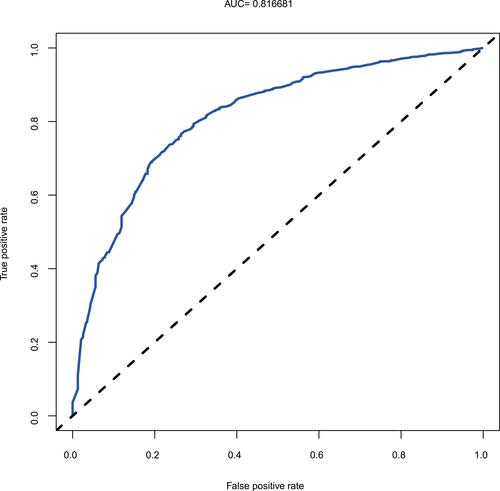
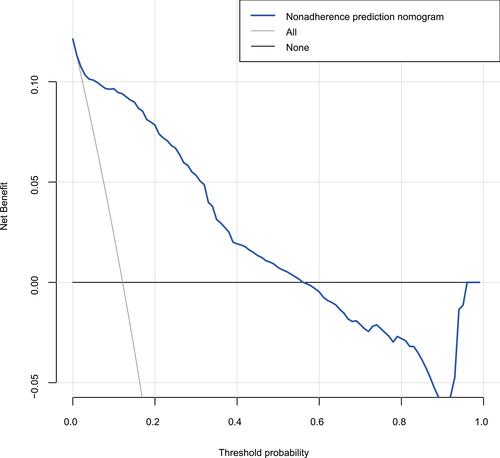
Figure 5 Decision curve of prediction models for the development of COPD.