Figures & data
Table 1 Baseline Characteristics of 18,586 Patients with COPD Stratified by Exacerbation Rate
Table 2 Lung Function After Bronchodilatation in COPD Patients Stratified by Exacerbation Rate
Figure 1 Exacerbation rate at baseline and during each year of follow-up in COPD patients with (n=18,586) and without (n=15,920) a concurrent asthma diagnosis.
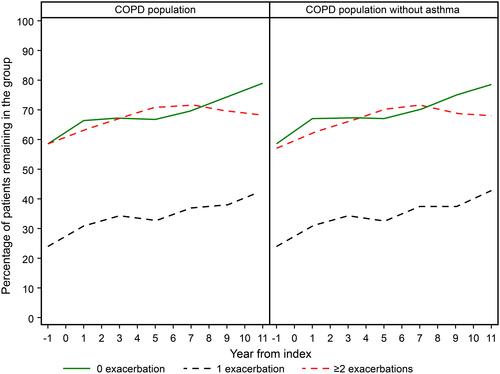
Figure 2 Exacerbation rate during the first three years of follow-up after index date in 18,586 patients with COPD.
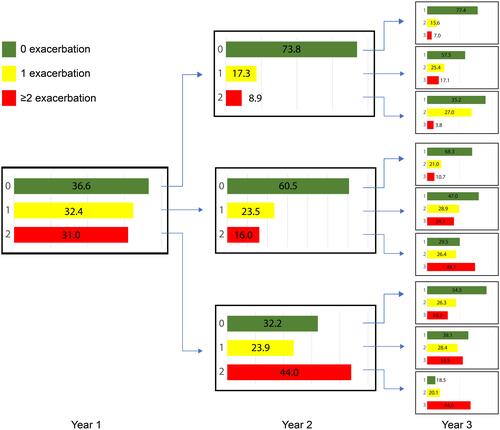
Figure 3 Mortality related to the average number of annual exacerbations during the complete follow-up period before death in COPD patients with (n=18,586) and without (n=15,920) a concurrent asthma diagnosis.
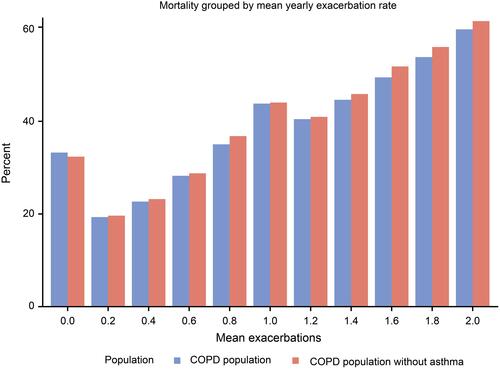
Figure 4 Post bronchodilator lung function decline related to exacerbation rate during follow-up in COPD patients with (n=18,586) and without (n=15,920) a concurrent asthma diagnosis.
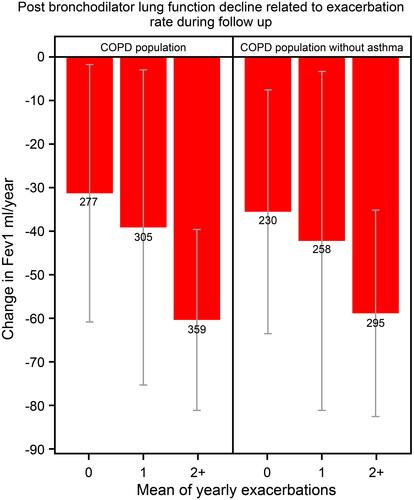
Figure 5 Cumulative dispensation, representing prescription during the preceding year, of respiratory drugs during a follow-up period of 8 years in 18,586 patients with COPD.
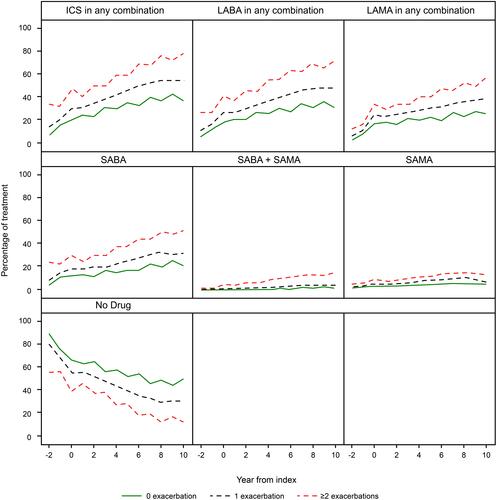
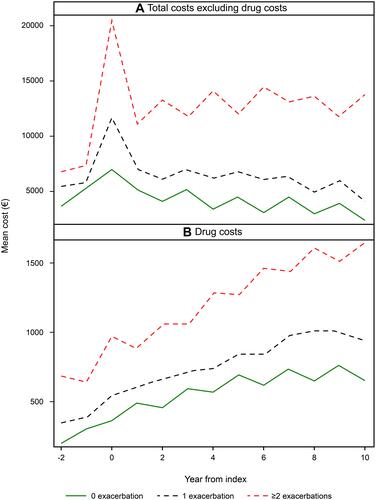
Figure 6 Total direct costs excluding drug costs (A) and costs for drugs in COPD patients (B) with 0, 1 and ≥2 exacerbations per year during 11 years of follow-up.