
Figures & data
Figure 1(A) Prevalence of frequent comorbid conditions (panel A)*. *Graphical representation of the comorbidities found in 6 large European studies (see Supplementary Data); lines (I–I) connect the minimal and maximal prevalence rates found in these studies; diamonds (
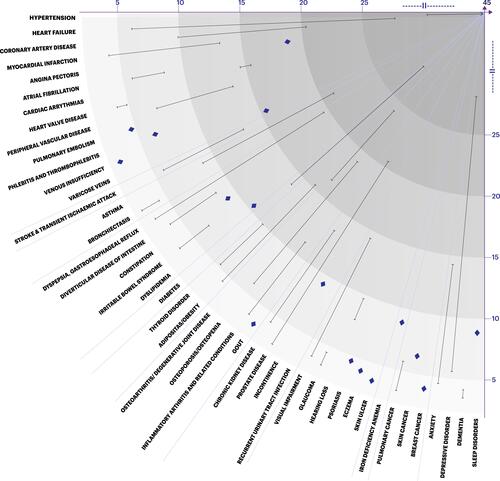
Figure 1(B) Visual interpretation of COPD medication recommendations§. §Pneumonia data based on LipsonCitation28 and Papi.Citation27
Abbreviations: COPD, chronic obstructive pulmonary disease; ICS, inhaled corticosteroid (yellow); LABA, long-acting β2-agonist (blue); LAMA, long-acting antimuscarinic (green).
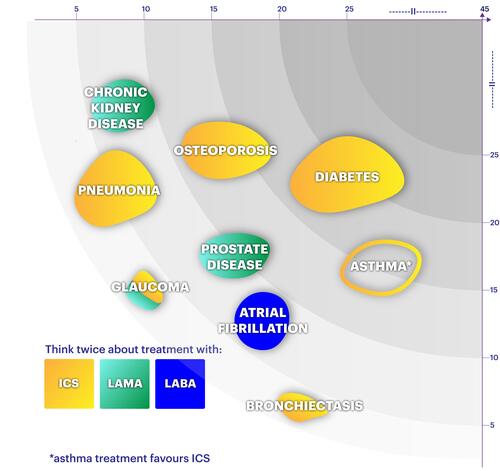
Table 1 Initiatives for Withdrawal of Inhaled Corticosteroids in Primary Care
Table 2 Most Important Adverse Events Related to Inhaled COPD Maintenance Treatment
Table 3 Relationship Between COPD Comorbidities and ICS Treatment