Figures & data
Table 1 The Information on the Demographics of All Subjects
Figure 1 Circ-OSBPL2 is up-regulated in COPD tissues and CSE-induced HBECs. (A) qRT-PCR analysis of circ-OSBPL2 expression in 81 cases of lung tissue specimens from non-smokers (n = 21), smokers (n = 27), and smokers with COPD (n = 33) groups. (B) qRT-PCR analysis of circ-OSBPL2 expression in 16HBE cells (n=3) after varying concentration of CSE exposure (0, 0.5, 1, 2, 4%) for 24 h (vs the control group). (C) qRT-PCR analysis of circ-OSBPL2 expression in 16HBE cells (n=3) exposed to 2% CSE for 0, 6, 12, 24 and 48 h (vs the control group). (D) qRT-PCR analysis of circ-OSBPL2 and linear OSBPL2 mRNA expression in 16HBE cells after RNase R treatment (n=3). (E) qRT-PCR analysis of circ-OSBPL2, GAPDH, and U6 RNA in purified 16HBE cell nuclear and cytoplasmic fractions (n=3). *P <0.05, **P< 0.01, ***P<0.001, ****P < 0.0001.
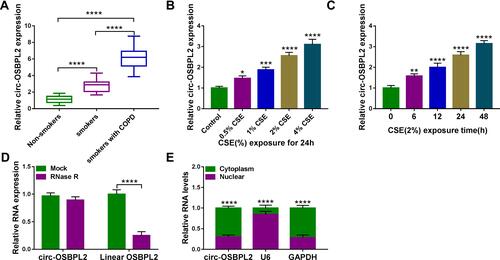
Figure 2 CSE suppresses the viability and induces the apoptosis, inflammation and oxidative stress in HBECs. (A–F) 16HBE cells were treated with varying concentration of CSE exposure (0, 0.5, 1, 2, 4%) for 24 h (n=3). (A) CCK-8 assay of cell viability. (B and C) Flow cytometry for cell apoptosis analysis. (D) Detection of IL-8, IL-1β, and TNF-α levels in cells using ELISA. (E and F) Measurement of MDA and SOD levels in cells using Commercial kits. *P <0.05, **P< 0.01, ***P<0.001, ****P < 0.0001 vs the control group.
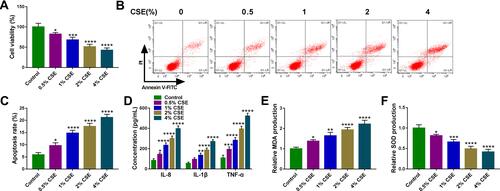
Figure 3 Circ-OSBPL2 knockdown reverses CSE-induced apoptosis, inflammation and oxidative stress in HBECs. (A–F) 16HBE cells were transfected with si-circ-OSBPL2 or si-NC, followed by treatment with 2% CSE for 24 h (n=3). (A) qRT-PCR analysis of circ-OSBPL2 expression in cells. (B) Cell viability analysis using CCK-8 assay. (C) Cell apoptosis analysis with flow cytometry. (D) ELISA for the detection of IL-8, IL-1β, and TNF-α levels. (E and F) Measurement of MDA and SOD levels in cells using Commercial kits. **P< 0.01, ***P<0.001, ****P < 0.0001.
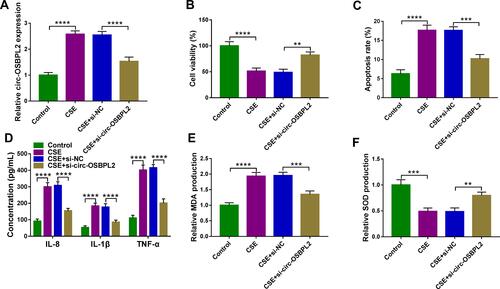
Figure 4 MiR-193a-5p is a target of circ-OSBPL2. (A) The potential binding sites of miR-193a-5p in the circ-OSBPL2. (B and C) The interaction analysis between miR-193a-5p and circ-OSBPL2 using dual-luciferase reporter assay and RIP assay (n=3). (D) qRT-PCR analysis of miR-193a-5p expression in 81 cases of lung tissue specimens from non-smokers (n = 21), smokers (n = 27), and smokers with COPD (n = 33) groups. (E) qRT-PCR analysis of miR-193a-5p expression in 16HBE cells (n=3) after varying concentration of CSE exposure (0, 0.5, 1, 2, 4%) for 24 h (vs the control group). (F) qRT-PCR analysis of miR-193a-5p expression in 16HBE cells (n=3) exposed to 2% CSE for 0, 6, 12, 24 and 48 h (vs the control group). (G) Correlation analysis between miR-193a-5p and circ-OSBPL2 expression in tissues from COPD patients (n=33). (H) 16HBE cells were transfected with pCD5-ciR or circ-OSBPL2, followed by treatment with 2% CSE for 24 h, and circ-OSBPL2 expression in cells was detected using qRT-PCR (n=3). (I) 16HBE cells were transfected with si-circ-OSBPL2, si-NC, pCD5-ciR or circ-OSBPL2, followed by treatment with 2% CSE for 24 h, and miR-193a-5p expression in cells was detected using qRT-PCR (n=3). *P <0.05, **P< 0.01, ****P < 0.0001.
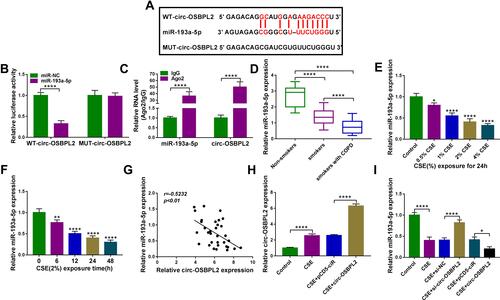
Figure 5 Circ-OSBPL2 knockdown reverses CSE-induced apoptosis, inflammation and oxidative stress in HBECs via targeting miR-193a-5p. (A–F) 16HBE cells were transfected with si-NC, si-circ-OSBPL2, si-circ-OSBPL2 + anti-miR-NC, or si-circ-OSBPL2 + anti-miR-193a-5p, followed by treatment with 2% CSE for 24 h (n=3). (A) qRT-PCR analysis of miR-193a-5p expression in cells. (B) Cell viability analysis using CCK-8 assay. (C) Cell apoptosis analysis with flow cytometry. (D) ELISA for the detection of IL-8, IL-1β, and TNF-α levels. (E and F) Measurement of MDA and SOD levels in cells using Commercial kits. *P <0.05, **P< 0.01, ***P<0.001, ****P < 0.0001.
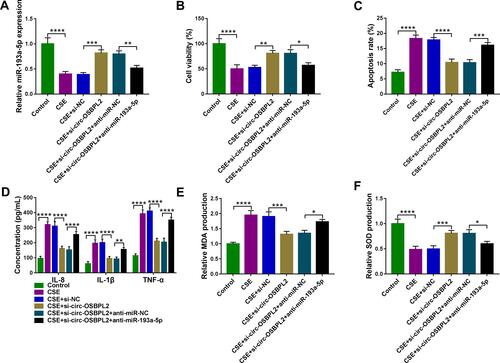
Figure 6 BRD4 is a target of miR-193a-5p. (A) The potential binding sites of miR-193a-5p in the BRD4 3ʹUTR. (B and C) The interaction analysis between miR-193a-5p and BRD4 using dual-luciferase reporter assay and RIP assay (n=3). (D and E) qRT-PCR and Western blot analysis of BRD4 expression in 81 cases of lung tissue specimens from non-smokers (n = 21), smokers (n = 27), and smokers with COPD (n = 33) groups. (F) Correlation analysis between miR-193a-5p and BRD4 expression in tissues from COPD patients (n=33). (G) Western blot analysis of BRD4 expression in 16HBE cells (n=3) after varying concentration of CSE exposure (0, 0.5, 1, 2, 4%) for 24 h (vs the control group). (H) Western blot analysis of BRD4 expression in 16HBE cells (n=3) exposed to 2% CSE for 0, 6, 12, 24 and 48 h (vs the control group). (I and J) 16HBE cells were transfected with miR-NC, miR-193a-5p, anti-miR-NC, anti-miR-193a-5p, followed by treatment with 2% CSE for 24 h (n=3). (I) qRT-PCR analysis of miR-193a-5p expression in cells. (J) Western blot analysis of BRD4 expression in cells. **P< 0.01, ***P<0.001, ****P < 0.0001.
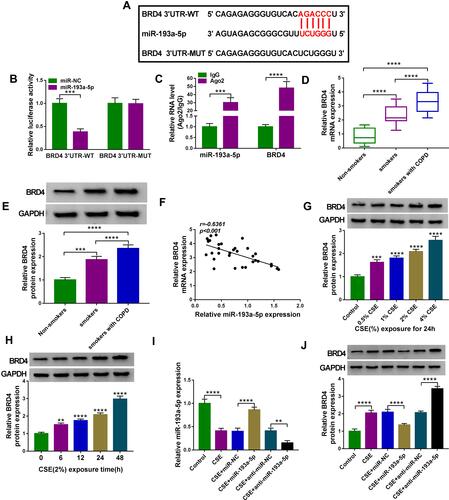
Figure 7 MiR-193a-5p attenuates CSE-induced apoptosis, inflammation and oxidative stress in HBECs via targeting BRD4. (A–F) 16HBE cells were transfected with miR-NC, miR-193a-5p, miR-193a-5p + pcDNA, or miR-193a-5p + BRD4, followed by treatment with 2% CSE for 24 h (n=3). (A) Western blot analysis of BRD4 expression in cells. (B) CCK-8 assay of cell viability. (C) Flow cytometry for cell apoptosis analysis. (D) Detection of IL-8, IL-1β, and TNF-α levels in cells using ELISA. (E and F) Measurement of MDA and SOD levels in cells using Commercial kits. *P <0.05, **P<0.01, ***P<0.001, ****P< 0.0001.
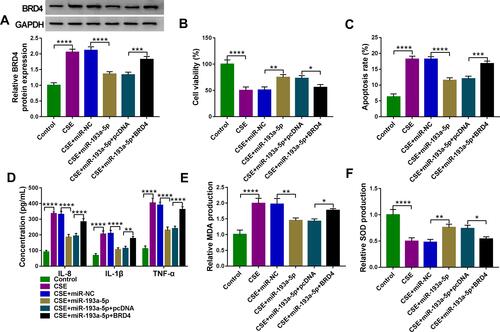
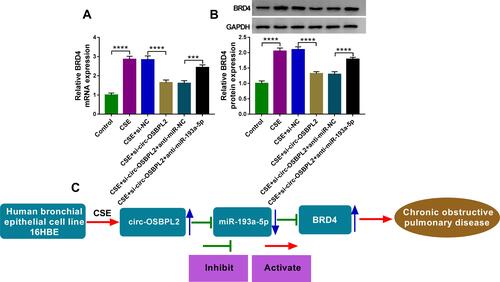
Figure 8 Circ-OSBPL2 can regulate BRD4 expression through serving as a sponge for miR-193a-5p. (A and B) 16HBE cells were transfected with si-NC, si-circ-OSBPL2, si-circ-OSBPL2 + anti-miR-NC, or si-circ-OSBPL2 + anti-miR-193a-5p, followed by treatment with 2% CSE for 24 h, the expression of BRD4 was detected using qRT-PCR and Western blot assays (n=3). (C) Schematic diagram of how circ-OSBPL2 involves in the pathogenesis of COPD (Blue Arrows, ↑increase; ↓decrease). ***P<0.001, ****P< 0.0001.