Figures & data
Table 1 Clinical Characteristics of the COPD Cohort
Table 2 Concentrations of Eicosanoids in Induced Sputum in COPD and Healthy Controls
Figure 1 Heat map presenting concentrations of selected eicosanoids.
Notes: (A) Healthy controls, (B) COPD subjects with noneosinophilic airway inflammation, (C) COPD subjects with eosinophilic airway inflammation.
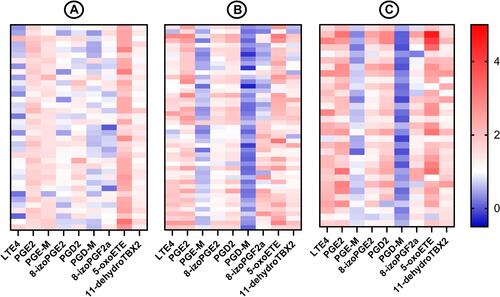
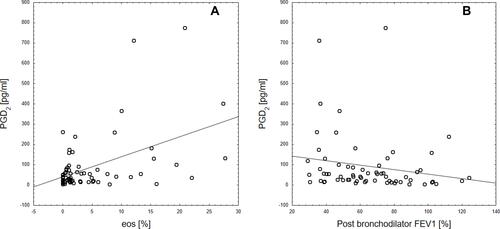
Figure 2 Correlations between PGD2 and sputum eosinophilia (A) and post-bronchodilator FEV1 (B).