Figures & data
Table 1 Baseline Characteristics of Study Participants
Figure 1 The study flow chart.
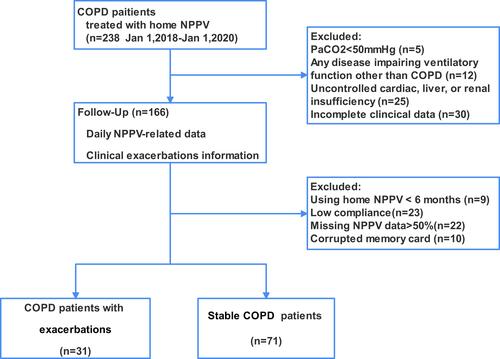
Table 2 Timing of Changes in Variability of NPPV-Related Parameter in the Days Before AECOPD (Demonstrated for 7-Day Analysis Windows)
Table 3 Comparison of Parameter Recorded by NPPV Software in the Days Before AECOPD Between AECOPD Group and Stable Group (Demonstrated for 7-Day Analysis Windows)
Figure 2 Timing of changes in variability of NPPV parameter before AECOPD. (A) Respiratory rate; (B) daily usage; (C) leaks; (D) tidal volume. Data reported as mean with SD.
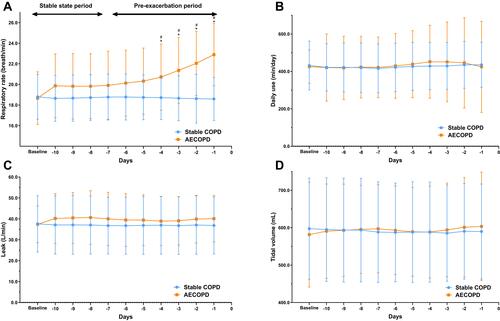
Table 4 Univariate and Multivariate Logistic Regression Analysis of Changes in NPPV Parameters Associated with the Risk of Exacerbation
Table 5 Receiver Operating Characteristic Analysis of NPPV Parameters to Predict AECOPD
Figure 3 Nomogram for AECOPD risk and its predictive performance. (A) Nomogram to estimate the risk of AECOPD based on NPPV-related parameters. (B) Internal validity of the predictive performance of the nomogram in using the bootstrap validation method.
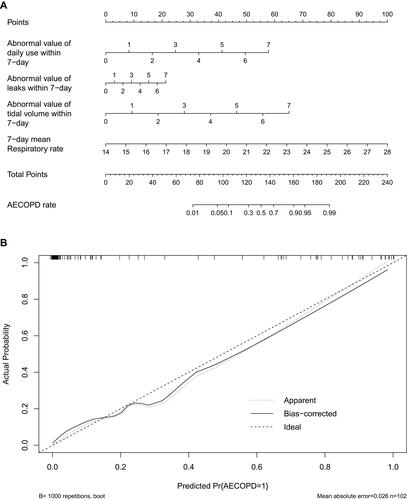
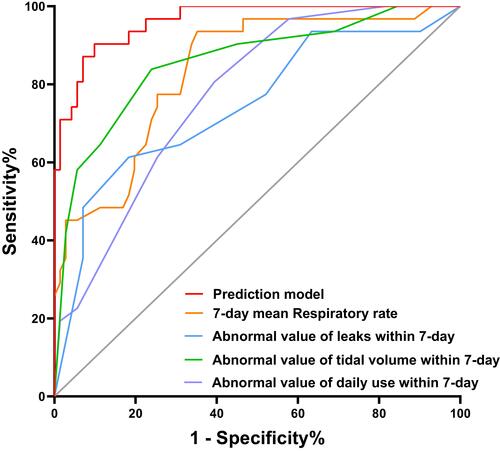
Figure 4 Receiver operating characteristic curves for predicting the risk of AECOPD.