Figures & data
Table 1 Stretching Methods for Different Muscles
Table 2 Baseline Characteristics of the Study Patients
Figure 1 Study flow diagram.
Abbreviations: FEV1, forced expiratory volume in the first second; PNF, proprioceptive neuromuscular facilitation; GOLD, Global Initiative for Chronic Obstructive Pulmonary Disease.
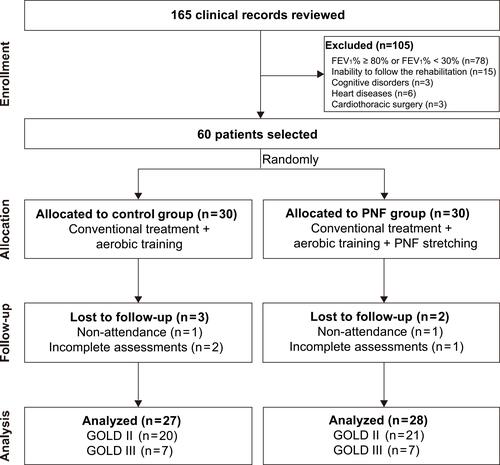
Figure 2 Comparison of respiratory symptoms, pulmonary function and muscular movement before and after rehabilitation training in different groups. (A) CAT score; (B) dyspnea VAS score; (C) FVC% predicted; (D) FEV1% predicted; (E) IC; (F) IRV; (G) 6MWT; (H) head protraction ROM; (I) maximum head protraction; (J) maximum head retraction; (K) shoulder flexion ROM; (L) PmM length. *P < 0.05, ***P < 0.001.
Abbreviations: PNF, proprioceptive neuromuscular facilitation; BMI, body mass index; CAT, COPD Assessment Test; VAS, Visual Analogue Scale; FVC, forced vital capacity; FEV1, forced expiratory volume in the first second; IC, inspiratory capacity; IRV, inspiratory reserve volume; 6MWT, 6-minute walking distance test; ROM, range of motion.
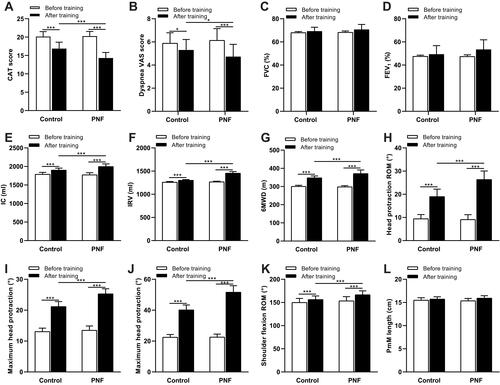
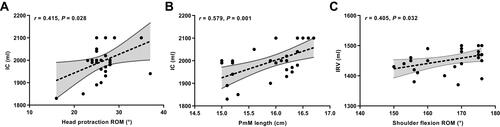
Figure 3 Correlation between neck/shoulder mobility and lung function in the PNF group. (A) Head protraction ROM and IC; (B) PmM length and IC; (C) shoulder flexion ROM and IRV.
Abbreviations: PNF, proprioceptive neuromuscular facilitation; ROM, range of motion; IC, inspiratory capacity; IRV, inspiratory reserve volume; PmM, pectoralis minor muscle.