
Figures & data
Table 1 Characteristics of the Patients at Baseline
Figure 1 Flow chart of patient registration process.
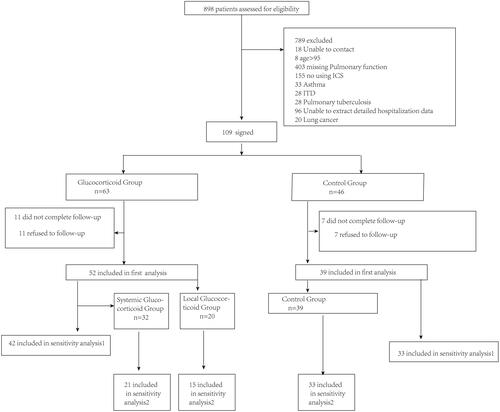
Figure 2 The ratio of the serious deterioration rate of COPD between the glucocorticoid group and the non-glucocorticoid group within one year after discharge, adjusting the number of hospitalization due to COPD in the year before admission, the number of eosinophil cells and the number of CRP before admission for the first time. The data in the bar chart represents the mean. *Means the difference was statistically significant.
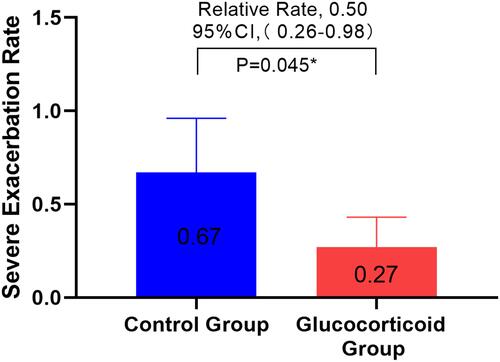
Figure 3 Only the people in the re-admission treatment group and the first admission group were analyzed. The ratio of the serious deterioration rate of COPD in the glucocorticoid group and the non-glucocorticoid group within one year after discharge was adjusted. The number of admission due to COPD, the number of blood eosinophils and the number of CRP in the first year before admission were adjusted.
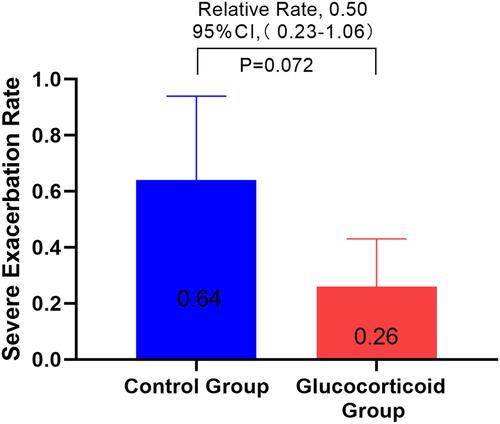
Figure 4 A subgroup analysis was made on whether there was acute aggravation of COPD one year before the first admission, and the ratio of severe deterioration of COPD between the glucocorticoid group and the non-glucocorticoid group.
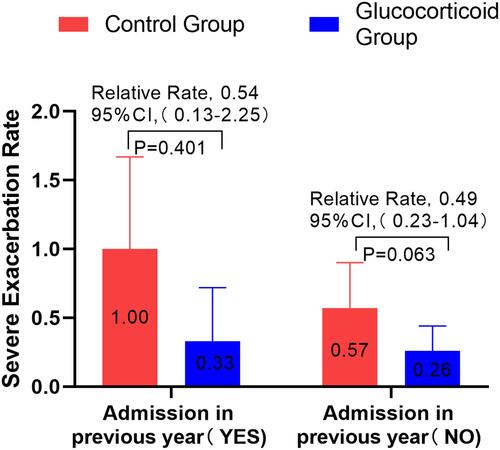
Figure 5 A subgroup analysis was made on whether eosinophil was less than 100 cell/μL before admission for the first time, and the ratio of severe deterioration rate of COPD between glucocorticoid group and non-glucocorticoid group. * Means the difference was statistically significant.
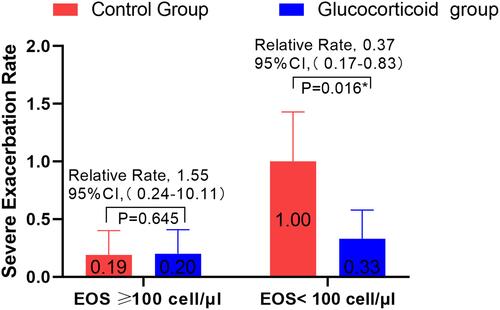
Figure 6 Bivariate correlation analysis of AECOPD patients: * means 0.05mm ≥ p > 0.01; ***means ≤ 0.001. The data in the box represents the r value.
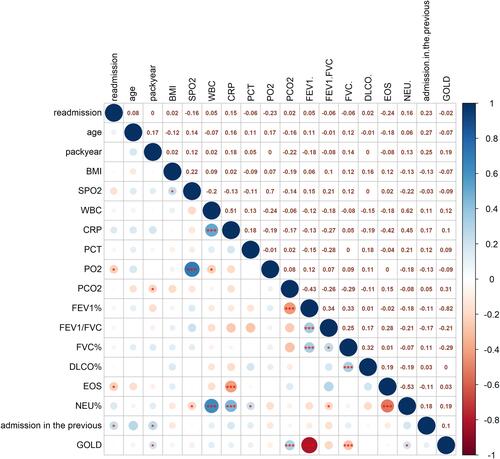
Figure 7 Ratio of severe deterioration of COPD in glucocorticoid group and non-glucocorticoid group in univariate model. BMI < 18.5 indicates malnutrition, BMI ≥ 25 indicates overnutrition, age > 65 represents advanced age, PO2 < 60 indicates hypoxemia, GOLD1-2 represents mild to moderate airflow limitation, GOLD3-4 represents severe acute and severe airflow limitation. #Use inhalation drugs during COPD stabilization.
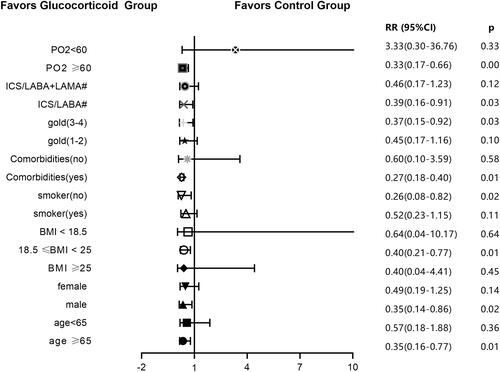
Figure 8 The time before the first COPD readmission of the patients in the control group (n = 39, red line) and the glucocorticoid group (n = 52, blue line), and the HR was obtained after correcting the baseline CRP value. The median time of the first severe deterioration in the two groups was not obtained.
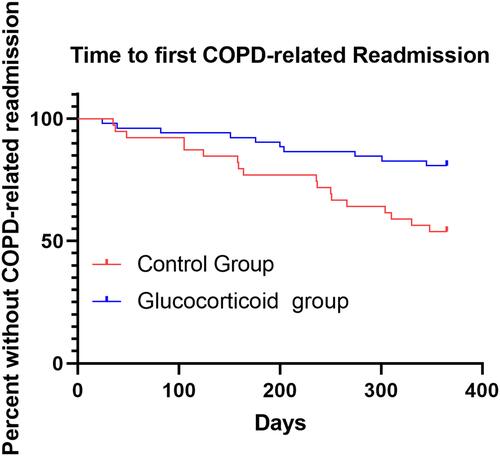
Figure 9 The hospitalization time of the glucocorticoid group and the control group, the median of the box chart is the median, and the bar stands for IQR.
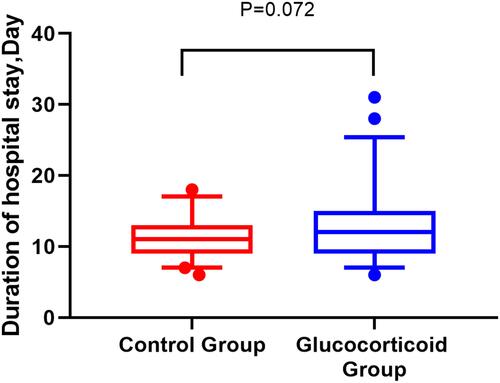
Figure 10 Medical expenses during hospitalization between the glucocorticoid group and the control group (RMB, yuan).
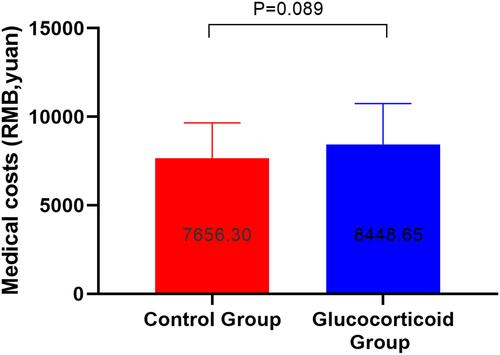
Table 2 Adverse Events
Table 3 Summary of Studies on the Relationship Between COPD and Glucocorticoid