
Figures & data
Table 1 Demography and Post-Bronchodilator Pulmonary Function Tests for 55 Stratum 1 (Healthy Never-Smokers), 133 Stratum 2, 237 Stratum 3 and 102 Stratum 4 Subjects
Figure 1 An expanded set of imaging-based metrics. (A) Local structures based on the image at inspiration: θ, Cr, WT*, and Dh*. (B) Global and lobar function based on images at inspiration and expiration: fSAD%. (C) Global and lobar function based on images at inspiration and expiration: Emph%. (D) Global structure. (E) Registration-based global and lobar functions.
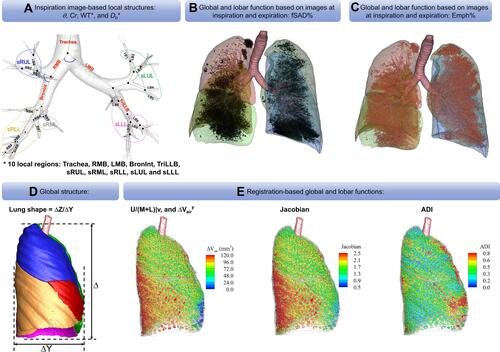
Figure 2 A summary of imaging and associated clinical characteristics between clusters. ●Baseline variables. ○One-year change variables. +Bigger than that of healthy never-smokers. ++Biggest among clusters. –Smaller than that of healthy never-smokers. –Smallest among clusters. ↑Increased over one year. ↓Decreased over one year.
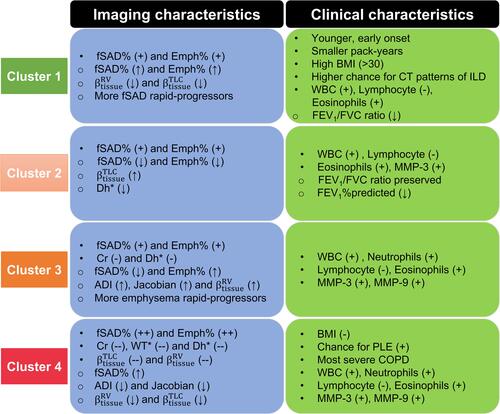
Table 2 Major Imaging-Based Features Selected by Wilk’s λ Method in Four Imaging-Based Clusters. The Importance of Variables is Decreasing from Left to Right and Top to Bottom
Table 3 Major Functional Features in Four Imaging-Based Clusters and Never Smokers (Stratum 1)
Table 4 Baseline fSAD and Its Progression in Each Cluster
Table 5 Baseline Emphysema and Its Progression in Each Cluster
Figure 3 Baseline fSAD% and Emph% and their change over one year. (A) fSAD% for four clusters and the healthy control group (green and represented by cluster h). (B) Emph% for four clusters and the healthy control group (green). (C) Percentage of change of fSAD% with respect to baseline fSAD% in total lung. (D) Percentage of change of Emph% with respect to baseline Emph% in total lung.
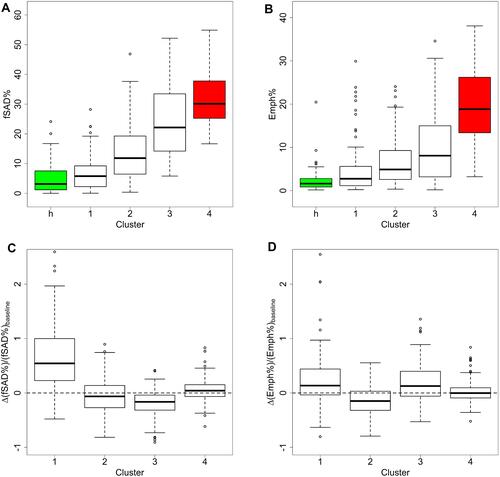
Figure 4 Changes of PFTs measures, fSAD% and Emph% over one year. (A) The average fSAD% and Emph% at baseline and follow-up visits. (B) The mean post-bronchodilator FEV1%predicted and FEV1/FVC ratio at baseline and follow-up visits.
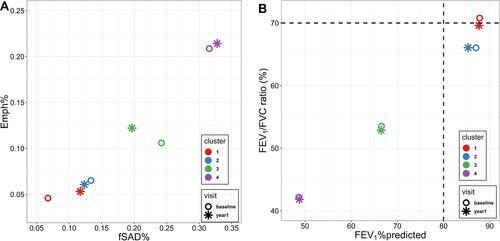
Figure 5 Baseline (left column) and one-year follow-up (right column) fSAD (red) and emphysematous regions (green) of cluster-representative subjects. (C1, C2, C3, and C4) refer to cluster 1, cluster 2, cluster 3, and cluster 4, respectively.
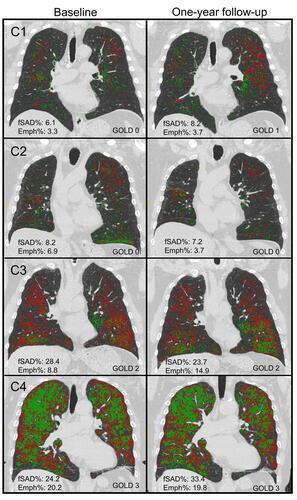
Figure 6 Baseline and its change over one year. (A)
for four clusters and the healthy control group at baseline (green). (B) Percentage of change of
with respect to
at baseline for four clusters.
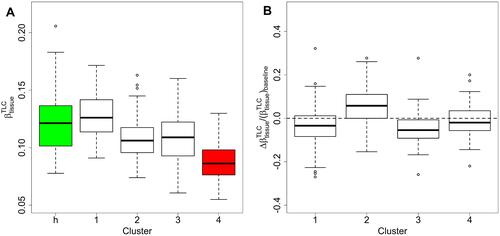
Table 6 Segmental Airway Features at Specific Regions
Table 7 Demography, Post-Bronchodilator PFTs in Four Imaging-Based Clusters
Table 8 Associations of Symptoms and Disease Histories with Cluster Membership
Table 9 Biomarkers for Longitudinal Clusters