Figures & data
Table 1 Patient Characteristics of Participants with Available Sputum
Table 2 Correlation Analysis of Participant Characteristics and Sputum AMP Concentrations in All Participants. Significant Correlation Where *p<0.5, **p<0.01, ***p<0.001
Figure 1 Comparison of peptide levels in sputum from healthy donors (n=9), asthmatics (n=21) and patients with COPD (n=14) tested in duplicate. (A) SLPI, (B) osteopontin, (C) elafin and (D) beta defensin-1. Data shown as geometric mean and 95% confidence intervals. Significant differences represented as *p<0.05, **p<0.01, ****p<0.0001.
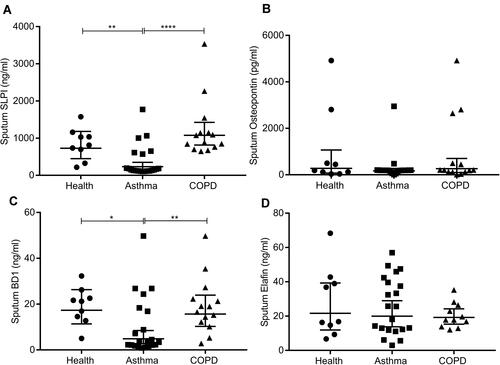
Figure 2 Peptide levels in sputum from asthmatics and COPD patients grouped into sputum neutrophil high and low groups are similar. (A) SLPI, (B) osteopontin, (C) elafin and (D) beta defensin-1. Graph showing asthmatic patients (n=21) (o) and COPD patients (n=14) (●), tested in duplicate. Data shown as geometric mean and 95% confidence intervals.
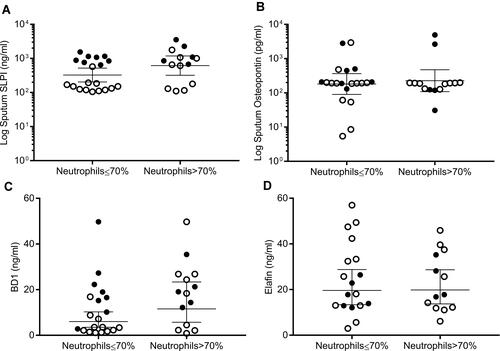
Figure 3 Correlation of NTHi presence in the airway and peptide levels in healthy donors (n=7, white dots), patients with COPD (n=9, grey dots) and asthma (n=2, black dots), tested in duplicate. (A) SLPI, (B) osteopontin, (C) elafin and (D) beta defensin-1.
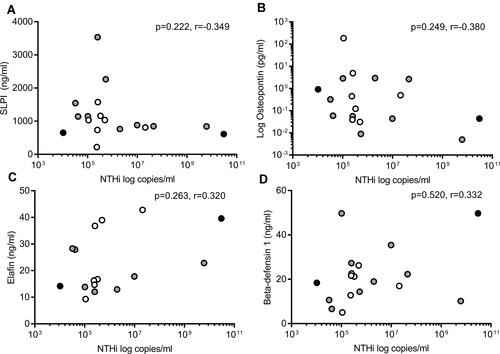
Figure 4 (A) Beta defensin-1 release from HBECs when untreated and infected with NTHi. (B) Elafin release from HBECs when untreated and infected with NTHi. Results are shown as a mean percentage change from untreated cell release. Tests were run in duplicate per experiment, from three separate experiments for each donor. Donors: health (n=3, white bars) and COPD (n=3, grey bars). Significant changes form basal release shown as * p<0.05 and ** p<0.01.
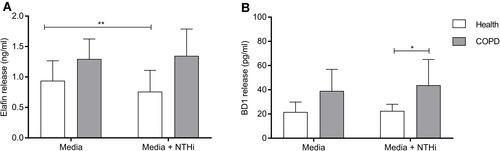
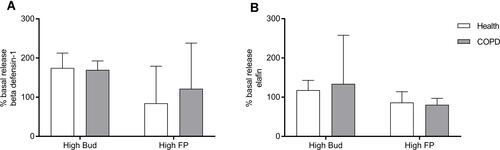
Figure 5 (A) Beta defensin-1 release from HBECs treated with high steroid concentrations. (B) Elafin release from HBECs treated with high steroid concentrations. Results are shown as a mean percentage change from untreated cell release. Tests were run in duplicate per experiment, from three separate experiments for each donor. High Budesonide (Bud): 16nM, High Fluticasone propionate (FP): 10nM. Donors: health (n=3, white bars), COPD (n=3, grey bars).