
Figures & data
Table 1 Prevalence of Comorbidities in the Pooled Patient Population from GOLDEN 3 and 4
Table 2 Demographics and Baseline Characteristics for the Baseline Comorbidity Prevalence Groups
Table 3 Baseline FEV1, FVC, SGRQ Total and Domain Scores in the Comorbidity Groups, by Treatment
Table 4 Participant Distribution by Baseline CVD Status
Table 5 Baseline Demographics and Disease Characteristics by CVD Status
Figure 1 Pooled analysis of trough FEV1 at 12 weeks, by (A) baseline comorbidity prevalence group (Group A, ≤2 comorbidities and Group B, >2 comorbidities) and (B) baseline cardiovascular disease subgroup (ITT population). ****p<0.0001 vs placebo. The n values represent the number of patients with on-treatment data at Week 12.
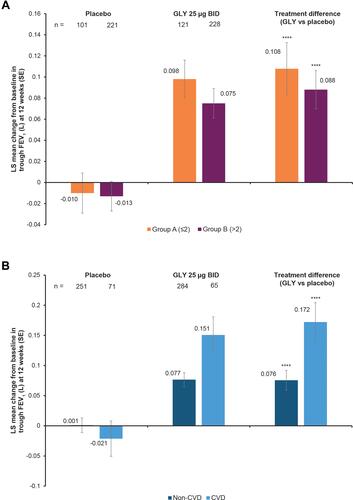
Figure 2 Pooled analysis of SGRQ total scores and component scores at 12 weeks, by (A) baseline comorbidity prevalence (Group A, ≤2 comorbidities and Group B, >2 comorbidities) and (B) baseline cardiovascular disease subgroup (ITT population). *p<0.05; **p<0.01; ***p<0.001 for GLY vs placebo.
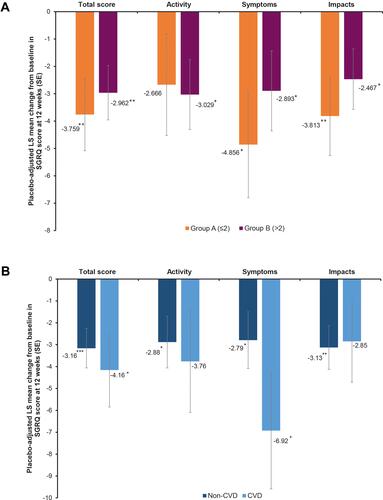
Figure 3 Pooled analysis of SGRQ responder rates at 12 weeks, by (A) baseline comorbidity prevalence group (Group A, ≤2 comorbidities and Group B, >2 comorbidities) and (B) cardiovascular disease subgroup (ITT population). *p<0.05, **p<0.01 vs placebo. The n values represent the number of patients with on-treatment data at Week 12.
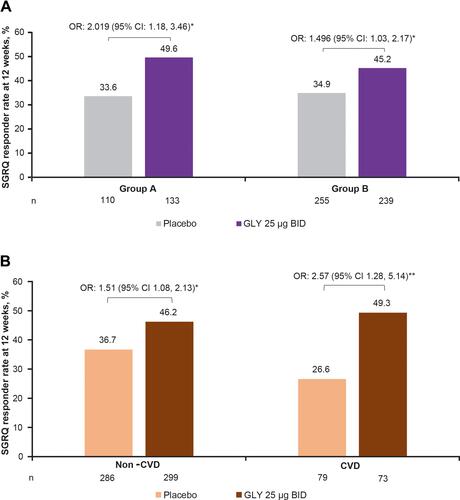
Table 6 Summary of AEs and SAEs, Including Individual AEs with Incidence ≥3% in Any Treatment Group, by Baseline Comorbidity Prevalence Group (Safety Population)
Table 7 Summary of AEs and SAEs, Including Individual AEs with Incidence ≥3% in Any Treatment Group, by Baseline CVD (Safety Population)
Table 8 Summary of Cardiovascular AESIs and MACE in Any Treatment Group, by Baseline CVD (Safety Population)