
Figures & data
Table 1 Study Designs
Table 2 Demographics and Baseline Characteristics
Table 3 FEV1 Endpoints at Study Enda
Figure 1 Change from baseline in trough FEV1 over the course of the studies comparing FF/VI versus placebo (A and B), UMEC versus placebo (C and D), and UMEC + FF/VI versus placebo + FF/VI (E and F). n=number of patients with data available for at least 1 time point; ***p≤0.001 vs placebo.
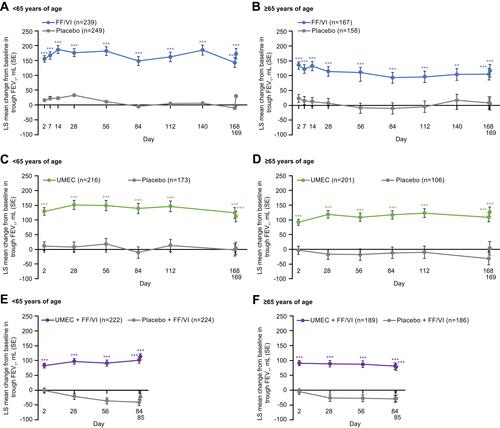
Figure 2 FEV1 responders (≥100 mL improvement from baseline in trough FEV1) at study end in studies comparing FF/VI versus placebo (A), UMEC versus placebo (B), and UMEC + FF/VI versus placebo + FF/VI (C).
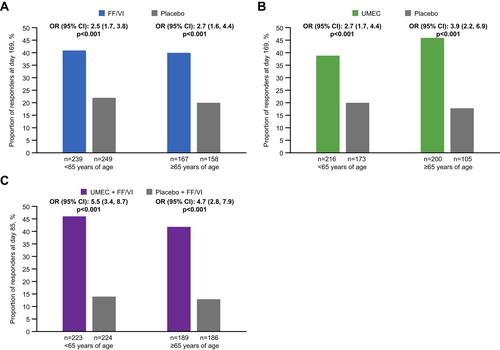
Figure 3 Ratio of trough FEV1/baseline FEV1 over the course of the studies comparing FF/VI versus placebo (A and B), UMEC versus placebo (C and D), and UMEC + FF/VI versus placebo + FF/VI (E and F). n=number of patients with data available for at least 1 time point; ***p≤0.001 vs placebo.
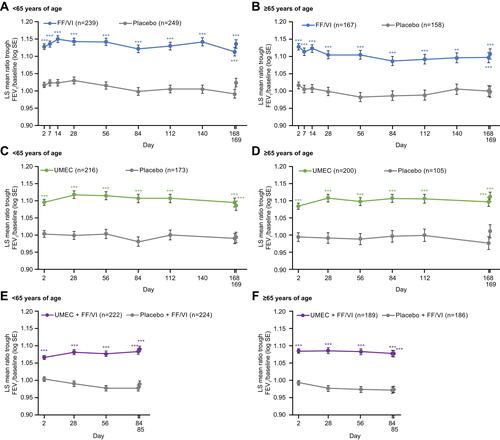
Table 4 Trough FVC at Study End
Table 5 Adverse Events