Figures & data
Figure 1 Study index period and the start of follow-up. A) gives an example timeline for case enrolment to the cohort. Eligibility was determined by the presence of a previous COPD medcode and at least 1-year history of GP consultations. This is illustrated using a red circle and covariate values used within regression models are established as closely as possible to the point of case enrolment. In this case, the medcode was a new entry but for many cases in the cohort, the code for COPD was present at the onset of the CPRD cohort. The example shows a period of 1-year prior and a month after enrolment within which values were accepted. Outcomes of all-cause hospitalisation and mortality were recorded 12 months after the point of enrolment. (B) illustrates that the timespan of analysable patient data is highly variable depending on whether COPD was present at the onset of the CPRD cohort or diagnosed later during follow-up and whether the patient left the cohort (eg due to leaving the practice or death.
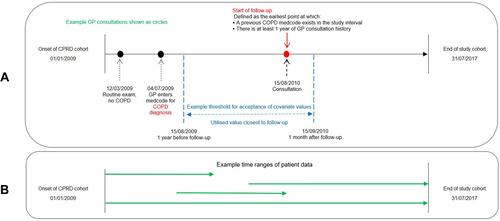
Table 1 Candidate Predictive Variables and Outcomes Used for Standard Regression Models
Figure 2 Production of ACG prediction performance measures for 12-month all-cause hospitalisation. Area Under the Curve (AUC) statistics are found as shown above for comparison against those for standard regression. Using patient details, healthcare usage, long-term conditions and prescriptions, the ACG grouper produces, for each patient, a list of outputs (). This is done separately for the training and test datasets. The standard ACG method only uses the test data; it combines ACG’s risk estimate for hospitalisation with the known binary outcome to produce an ROC curve and AUC. The ACG-tailored method uses all the ACG outputs. Treating them as independent predictive variables, a logistic regression model is derived on training data with the known outcome as the dependent variable. This is tested on the test data, producing an ROC and AUC.
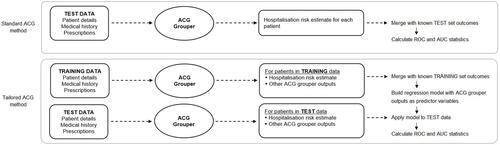
Table 2 Descriptive Statistics of Patient Cohort with COPD
Table 3 Mortality and Hospitalisation Group Comparisons
Figure 3 Flow chart of patient inclusion and exclusion. Medcode diagnosesCitation16 were applied to the CPRD population to identify those with COPD during the time interval (n = 184,724). The filtering process of the patient data where cases missing essential links to HES, ONS and IMD were excluded, as were those without a COPD diagnosis or less than a year of GP consultation history. Finally, patients missing three or more key variables of FEV1pp, MRC, haemoglobin and eosinophil were removed. The lower part of the figure shows data censoring of patients that had <12 months follow-up and no outcome of hospitalisation or mortality, and randomisation prior to modelling.
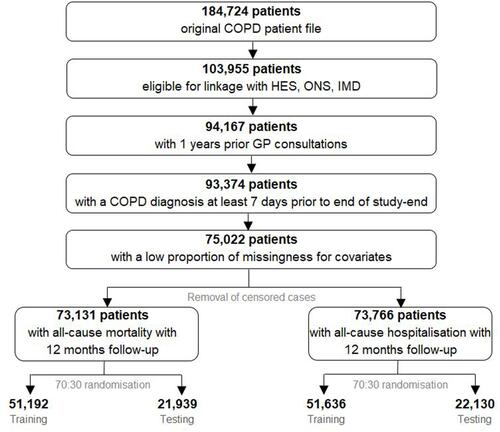
Table 4 ROC AUC Characteristics for Mortality (M) and Hospitalisation (H)
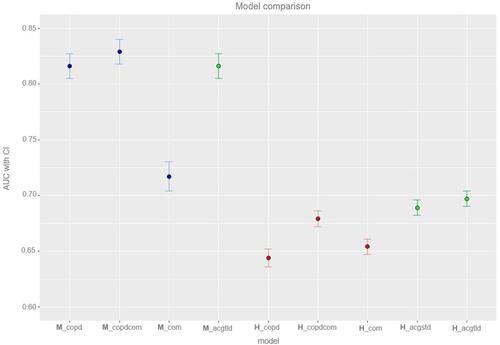
Figure 4 Model comparison. A graphical comparison of model classification on test cohort using the area under receiver operating characteristic (ROC) with 95% confidence intervals. x-Axis states which model has been used (see details below); y-axis identifies AUC (95% CI). Twelve-month all-cause mortality models, blue; 12-month all-cause hospitalisation predictors, red; ACG predictors, green.