Figures & data
Figure 1 The flowchart of this study.
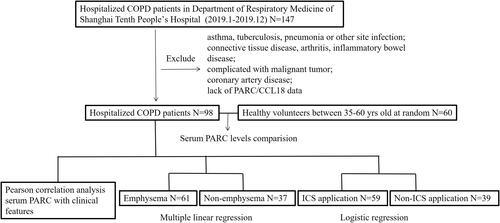
Table 1 Clinical Characteristics of the Subjects
Figure 2 Comparison of serum PARC/CCL18 concentration in COPD patients and healthy control. The central horizontal line on each box represents the average, the error bars 5% and 95%. P-values derived from the t-test. **Means p<0.01.
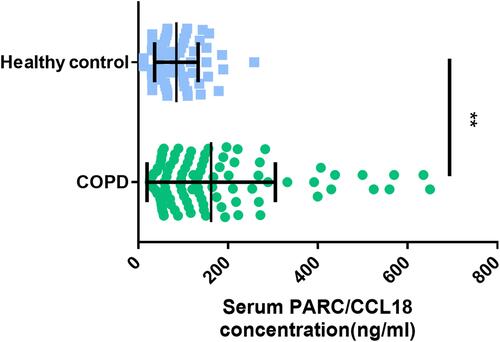
Figure 3 Comparison of serum PARC/CCL18 concentration in different Grade (A) and with different mMRC scores (B) of COPD patients. Relationship between CAT (C), disease duration (D), LOS (E), BMI (F) and serum PARC concentration, respectively. The central horizontal line on each box represents the average, the error bars 5% and 95%, p-values derived from the t-test in (A) and (B). **Means p<0.01. The line in (C) to (F) represents the regression line of correlation analysis, Pearson correlation coefficients of r-values and p-values were shown at the top right of the picture.
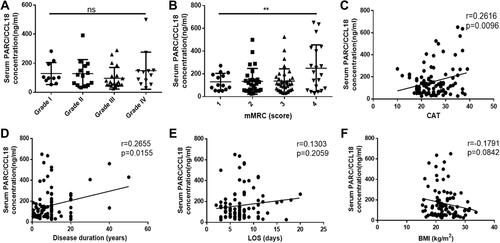
Figure 4 Correlation between WBC (A), Hb (B), Plt (C), Neut (D), Neut% (E), CRP (F) and serum PARC/CCL18 level, respectively. The line represents the regression line of correlation analysis, Pearson correlation coefficients of r-values and p-values were shown at the top right of the picture.
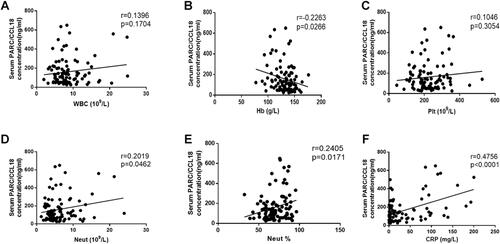
Table 2 Clinical Characteristics of COPD Patients with Emphysema and Not
Figure 5 Correlation between RV (A), TLC (B), RV/TLC (C) and serum PARC level, respectively. (D) shows the comparison of serum PARC/CCL18 concentration in emphysema and non-emphysema patients. The line represents the regression line of correlation analysis, Pearson correlation coefficients of r-values and p-values were shown at the top right of the picture. The central horizontal line on each box represents the average, the error bars 5% and 95%. P-values derived from the t-test. *Means p<0.05.
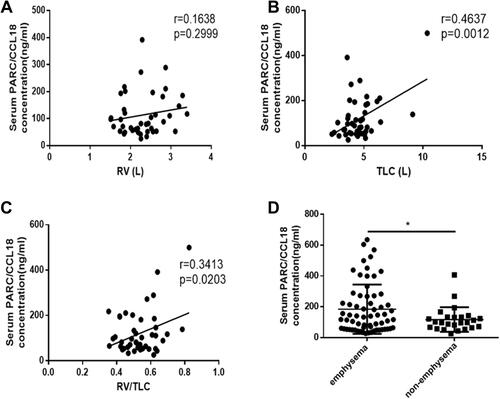
Table 3 Clinical Characteristics of COPD Patients with ICS and Not
Table 4 Multivariate Logistic Regression of Factors Associated with ICS Application
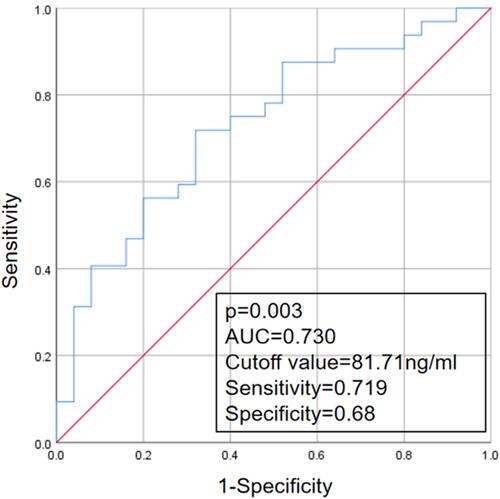
Figure 6 ROC curve analysis of PARC/CCL18 for ICS application.