Figures & data
Table 1 Characteristics of Patients in GOLD Groups A/B Stratified by Treatment with/without ICS
Figure 1 Consort diagram of the study population.
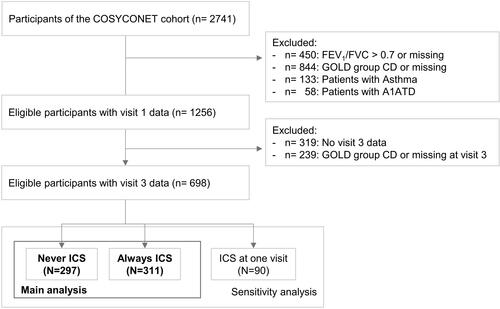
Table 2 Prevalence of Comorbidities
Table 3 Treatment with Respiratory Medication
Table 4 Mean Annual Direct Healthcare Costs in €
Figure 2 Determinants of ICS therapy before and after weighting. Standardized mean differences of variables were calculated based on propensity scores leading to inverse probability of treatment weights (IPW).
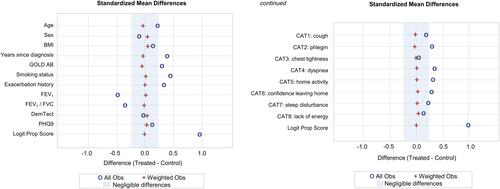
Table 5 Association Between ICS and Outcome Measures (Always vs Never)
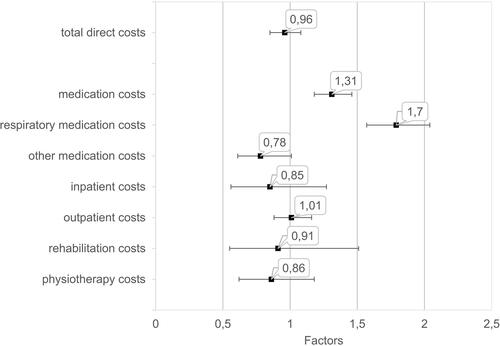
Figure 3 Effect of ICS therapy on direct healthcare costs. Factors with 95% CI for the variable ICS=always are shown. Each factor was calculated by a separate gamma regression model, adjusted for covariates and including the IPW (based on propensity scores).