Figures & data
Table 1 Demographic and Clinicopathological Characteristics of the Subjects in This Study
Table 2 The Used Oligonucleotides for Cell Transfection
Table 3 The Abbreviations of Constructs in Dual-Luciferase Reporter Assay
Figure 1 Upregulation of circ-HACE1 was found in smokers or smokers with COPD and CSE-treated 16HBE cells. (A) The qRT-PCR analysis was conducted to determine the expression of circ-HACE1 in serum samples from Non-smokers, smokers and smokers with COPD. The expression of circ-HACE1 in Non-smokers group was set as 1, and that in smokers and smokers with COPD groups were relative to Non-smoker group. (B) Circ-HACE1 level was detected using qRT-PCR after 16HBE cells treated with 1% CSE, 2% CSE or 4% CSE. The circ-HACE1 level in control group was set as 1, and that in three CSE treatment groups was compared to the control group. (C) The levels of circ-HACE1 and linear HACE1 were assayed by qRT-PCR after RNase R treatment in total RNA. RNA expression in Mock group was set as 1, and that in RNase R group was compared with Mock group. (D) Circ-HACE1, U6 and GAPDH expression detection was performed by qRT-PCR after RNA isolation from cytoplasm and nucleus of 16HBE cells. **P < 0.01, ***P < 0.001, ****P < 0.0001.
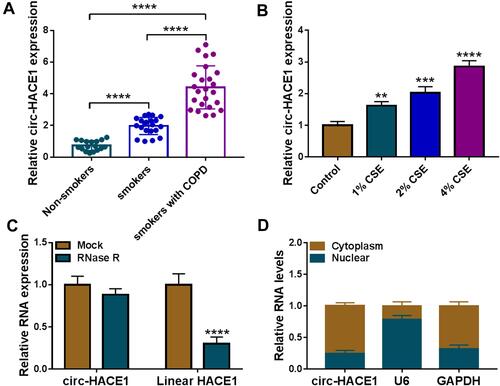
Figure 2 CSE-induced cell viability reduction, apoptosis acceleration, inflammatory and oxidative injuries were attenuated after knockdown of circ-HACE1 in 16HBE cells. (A) The expression of circ-HACE1 was examined using qRT-PCR after 16HBE cells were treated with 2% CSE and transfected with si-NC or si-circ-HACE1. The circ-HACE1 level in other three groups was compared to the control group (set as 1). (B) CCK-8 was carried out for cell viability analysis after CSE treatment with different concentrations (1%, 2%, 4%) in 16HBE cells. (C) Cell viability detection was performed by CCK-8 assay in control, 2% CSE, 2% CSE+si-NC or 2% CSE+si-circ-HACE1 groups. (D and E) Flow cytometry was used to assess cell apoptosis (D) and cell cycle progression (E) in control, 2% CSE, 2% CSE+si-NC or 2% CSE+si-circ-HACE1 groups. (F) ELISA was performed to measure the levels of IL-1β and TNF-α in control, 2% CSE, 2% CSE+si-NC or 2% CSE+si-circ-HACE1 groups. (G and H) MDA and SOD levels were determined for the evaluation of oxidative stress in control, 2% CSE, 2% CSE+si-NC or 2% CSE+si-circ-HACE1 groups. The relative production of MDA or SOD in each treatment group was compared to the control group (set as 1). *P < 0.05, **P < 0.01, ***P < 0.001, ****P < 0.0001.
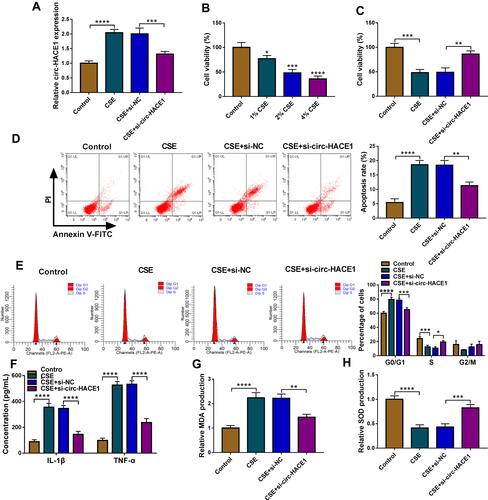
Figure 3 Circ-HACE1 regulated miR-485-3p as a sponge. (A) The Circinteractome software was applied to analyze the binding sites between circ-HACE1 and miR-485-3p sequences. (B) Dual-luciferase reporter assay was administrated for binding analysis between circ-HACE1 and miR-485-3p. (C and D) The qRT-PCR was used for miR-485-3p expression analysis in serum samples (C) and 1%, 2% or 4% CSE-treated 16HBE cells (D). The miR-485-3p expression in smokers/smokers with COPD groups was compared to the Non-smokers group (set as 1) and that in CSE treatment groups was compared to the control group (set as 1). (E) The relationship between circ-HACE1 and miR-485-3p was analyzed via Pearson’s correlation coefficient. (F) The overexpressed efficiency of circ-HACE1 vector was evaluated by qRT-PCR in 2% CSE-treated 16HBE cells. Circ-HACE1 expression in CSE, CSE+Vector or CSE+circ-HACE1 group was compared to control group (set as 1). (G) The effects on si-circ-HACE1 or circ-HACE1 on miR-485-3p level were analyzed through qRT-PCR in 2% CSE-treated 16HBE cells. The level of miR-485-3p in treatment groups was compared to control group (set as 1). *P < 0.05, **P < 0.01, ***P < 0.001, ****P < 0.0001.
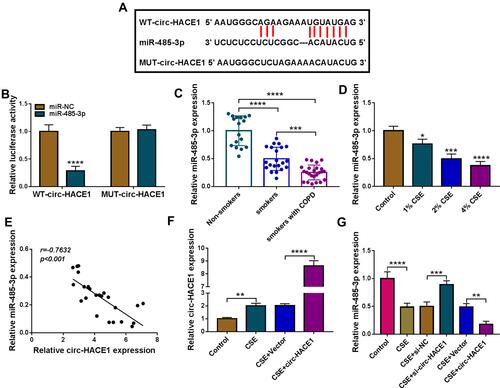
Figure 4 CSE-mediated injury in 16HBE cells was regulated by the circ-HACE1/miR-485-3p axis. 16HBE cells were treated with 2% CSE, 2% CSE+si-NC, 2% CSE+si-circ-HACE1, 2% CSE+si-circ-HACE1+anti-miR-NC or 2% CSE+si-circ-HACE1+anti-miR-485-3p, and untreated 16HBE cells were used as the control group. (A) The miR-485-3p level was detected applying with qRT-PCR, and miR-485-3p expression in each treatment group was contrasted with control group (set as 1). (B) Cell viability was examined by CCK-8 assay. (C–E) Cell apoptosis (C and D) and cell cycle progression (E) were analyzed via flow cytometry. (F and G) Inflammatory response was assessed through the concentrations of IL-1β and TNF-α. (H and I) Oxidative stress was evaluated by the levels of MDA (H) and SOD (I). The relative production of MDA or SOD in each treatment group was compared to the control group (set as 1). *P < 0.05, **P < 0.01, ***P < 0.001, ****P < 0.0001.
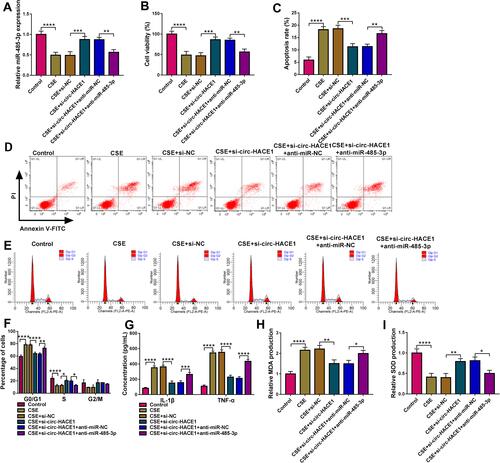
Figure 5 TLR4 acted as a target of miR-485-3p. (A) The binding sites of miR-485-3p in the 3ʹUTR of TLR4 were predicted by Targetscan. (B) The interaction between miR-485-3p and TLR4 3ʹUTR was proved by dual-luciferase reporter assay. (C) TLR4 mRNA expression was assayed by qRT-PCR in serum samples, and the expression in smoker or smoker with COPD group was compared to the Non-smoker group (set as 1). (D) Pearson’s correlation coefficient was used for linear analysis between miR-485-3p and TLR4. (E) Western blot was performed for the protein expression detection of TLR4 in 1%, 2% or 4% CSE-treated 16HBE cells. (F and G) After transfection of miR-485-3p mimic, miR-485-3p inhibitor or the matched controls in 2% CSE-treated 16HBE cells, the miR-485-3p level (F) and TLR4 protein expression (G) were respectively determined via qRT-PCR and Western blot. The level in control group was set as 1, and that in other each group was compared with the control group. **P < 0.01, ***P < 0.001, ****P < 0.0001.
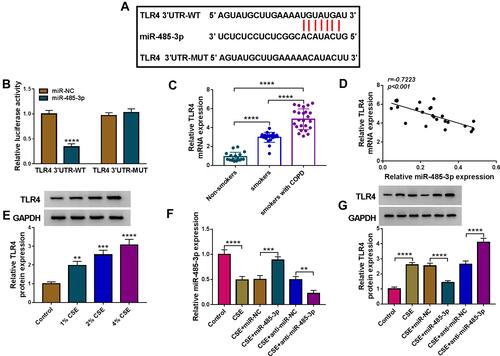
Figure 6 miR-485-3p delayed the CSE-induced cell damage via downregulating TLR4. Transfection of miR-485-3p, miR-485-3p+TLR4 or the corresponding controls was performed in 2% CSE-treated 16HBE cells. (A) The protein level of TLR4 was detected using Western blot. (B–E) The examination of cell viability (B) and apoptosis (C and D)/cell cycle (E) was completed by respective CCK-8 and flow cytometry. (F and G) The assessment of inflammation was conducted by measuring the concentrations of IL-1β and TNF-α. (H and I) MDA (H) and SOD (I) levels were used for the evaluation of oxidative injury. The relative production of MDA or SOD in each treatment group was compared to the control group (set as 1). *P < 0.05, **P < 0.01, ***P < 0.001, ****P < 0.0001.
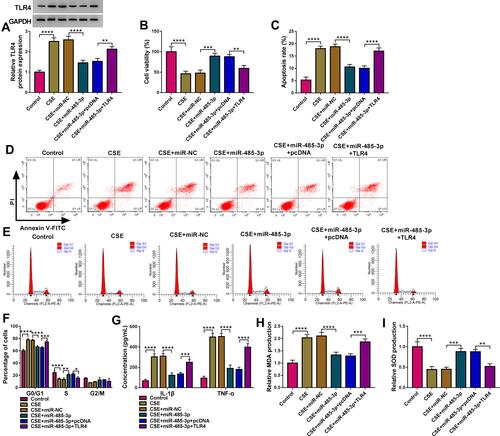
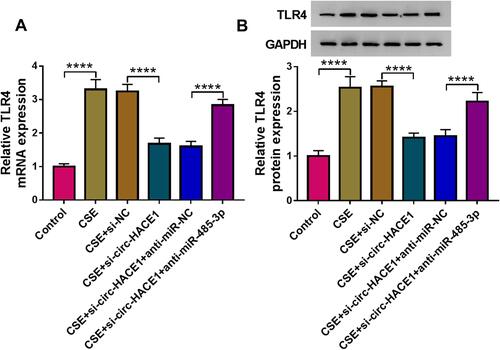
Figure 7 Knockdown of circ-HACE1 upregulated miR-485-3p to decrease TLR4 expression in CSE-treated 16HBE cells. (A and B) The qRT-PCR and Western blot were exploited for the measurement of TLR4 mRNA (A) and protein (B) in 2% CSE-treated 16HBE cells transfected with si-NC, si-circ-HACE1, si-circ-HACE1+anti-miR-NC or si-circ-HACE1+anti-miR-485-3p, with untreated cells as the control group. TLR4 expression in each treatment group was compared with the control group (set as 1). ****P < 0.0001.