Figures & data
Figure 1 Consort flow chart.
Abbreviations: SGRQ, Saint George’s Respiratory Questionnaire; QoL, Quality of Life; PAHCO, Physical activity-related Health Competence.
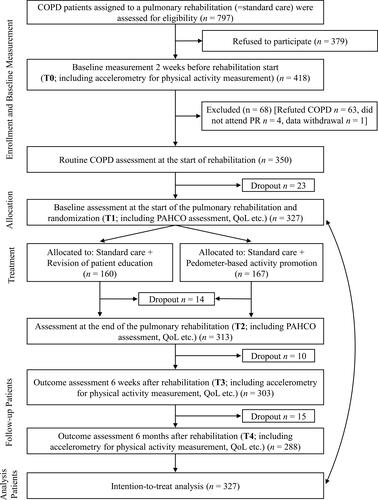
Table 1 Baseline Characteristics
Table 2 Mean Values (M) and Standard Deviations (SD) for Steps/Day (Primary Outcome), Moderate-Intensity Physical Activity, Sedentary Time, and Quality of Life (SGRQ Total) at Baseline (T0), Six Weeks (T3), and Six Months After Rehabilitation (T4)
Table 3 Adjusted Mean Differences (AMD) with 95% Confidence Intervals (95% CI), p-values and Cohen’s d Between Intervention Group and Control Group in Steps/Day (Primary Outcome), moderate-intensity Physical Activity, Sedentary Time and Quality of Life (SGRQ Total)
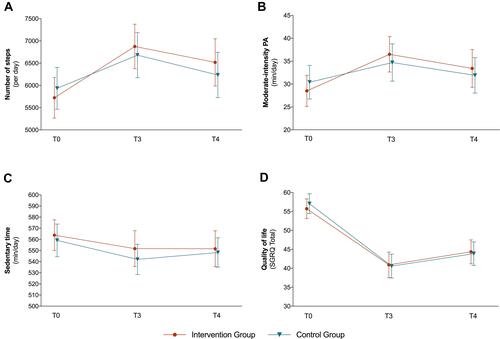
Figure 2 Changes in primary and secondary outcomes presented separately for the intervention group (IG) and control group (CG).
Notes: Vertical bars denote 95% confidence intervals; higher scores in the SGRQ indicate more limitations.
Abbreviations: PA, physical activity; SGRQ, Saint George´s Respiratory Questionnaire; T0, before the rehabilitation; T3, 6 weeks after rehabilitation; T4, 6 months after rehabilitation.