Figures & data
Table 1 Subject Particulars (n = 31)
Table 2 Baseline Lung Functions (n=31)
Table 3 Shows the Functional Groups/Clusters and Change (Up or Downregulated) in Proteins According to Clinical Phenotypes
Figure 1 Hierarchical clustering of subjects (n = 15) into four proteotypes. Proteotype 1 (extreme left): Irreversible obstructive disease. Proteotype 2 (second from left): No airflow obstruction, non-atopic; Proteotype 3 (second from right): “high eosinophilic and atopic” with reversible airflow obstruction; Proteotype 4 (extreme right): “eosinophilic and atopic” without airflow obstruction. Highly eosinophilic-count more than 600 cells/cumm, eosinophilic-count >300 cells/cumm, Atopic-S Immunoglobulin E >120IU/l. *Is a symbol used in R programming which denotes” repetition”. The algorithm used here for hierarchical clustering was Ward D and the distance calculation method was by the Euclidean method.
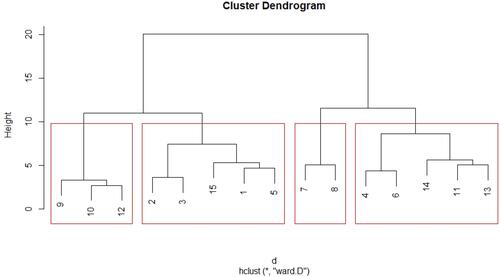
Figure 2 STRING functional protein association network analysis of 21 proteins which were consistently up and down regulated in particular phenotypes (3 proteins which did not have direct association with the other proteins have been excluded); MCL (with inflation parameter 3) clusters shows 5 clusters.
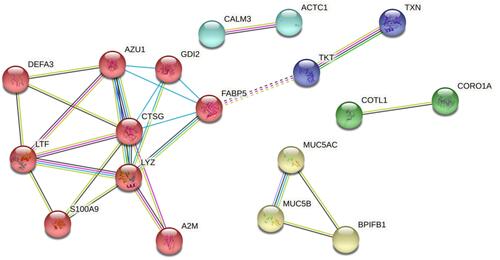
Figure 3 Proteotype wise analysis (Plot of Mean and SD) shows eight proteins to be statistically different among the proteotypes. The other proteins did not have significant differences between the prototypes. Noteworthy, in Proteotype1 (P1, green) inflammatory (Azurocidin1, Neutrophil defensin 3, Lactotransferrin) and mucin related proteins (Mucin 5B, Mucin 5 AC and BPIFB1) were increased while the calcium related proteins were decreased. In Proteotype 3, all mucin related proteins along with neutrophil defensin 3 (DEFA3) and Lactotransferrin (LTF) were decreased. In proteotype 2, mucin related proteins were elevated while in proteotype 4 the calcium related proteins were elevated.
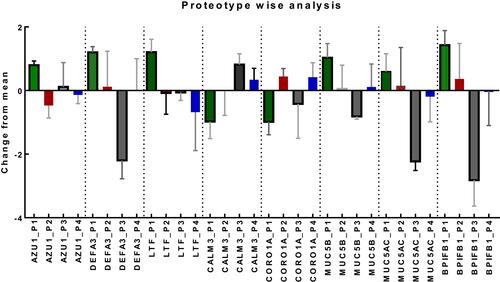
Figure 4 (A) Proteins related with inflammation and its association with exacerbations include: Azurocidin 1 (p = 0.0126), Neutrophil defensin (p=0.0342) and Lactotransferrin (p = 0.0128); (Plot of mean and SD); p values are from independent sample t-test; (B) Calcium related proteins and exacerbators show that significant difference in change from mean in two proteins Calmodulin 3 (p = 0.0361) and Coronin 1A (p = 0.0112); (plot of Mean and SD). p values are from independent sample t-tests. (C) Mucin related proteins and exacerbator analysis show that significant difference in change from mean in the proteins (plot of Mean and SD). Mucin 5B (p = 0.048), Mucin 5AC (p = 0.0273) and BPI Fold containing family B1 (p = 0.0246); p values are from independent sample t-test for each protein. (D) Oxidative stress related proteins and exacerbator analysis shows no association with exacerbators. (plot of Mean and SD).
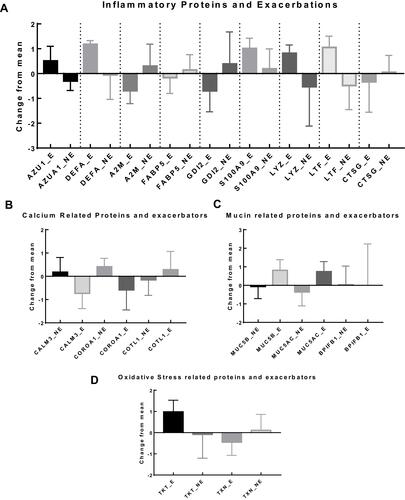
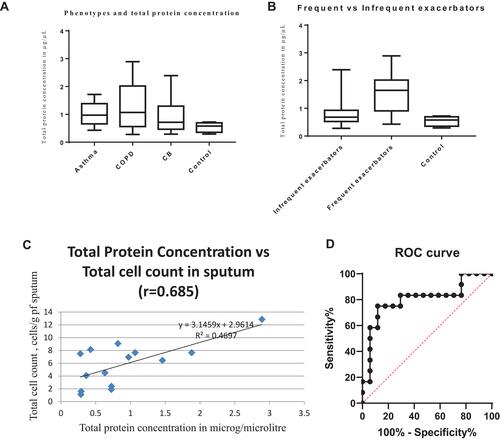
Figure 5 (A) Total protein concentration in the different phenotypes of airway disease was significantly different (p = 0.0344, Bartlett’s test); (B) Significant difference in total protein concentration in “ exacerbation prone” compared to “infrequent exacerbators” or non-exacerbators (p = 0.0184). (C) Correlation between total protein concentration vs total cell count in sputum quantitative assay. (D) Receiver operator characteristic curve for total protein concentration and exacerbators; Area under curve = 0.8039 (95% confidence interval 0.6260 to 0.9818).