Figures & data
Table 1 Demographics and Clinical Characteristics in the Each Group of Subjects
Table 2 Measurement Indicators in the Each Group of Subjects
Figure 1 Representative flow cytometric dot-plots of peripheral blood Th17 cells in the each group of subjects. (A) is Healthy control; (B) is COPD patient; (C) is T2DM patient; (D) is COPD+T2DM patient. The percentage of positive cells is shown in each panel.
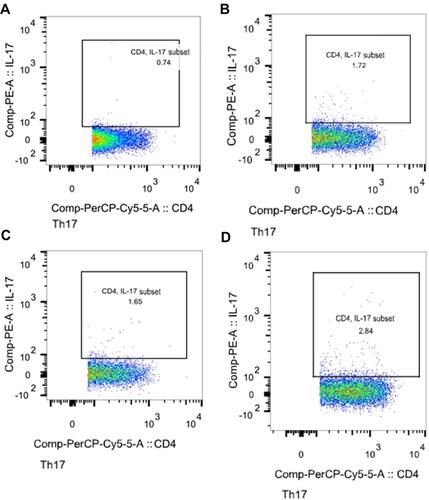
Figure 2 Representative flow cytometric dot-plots of peripheral blood Tregs cells in the each group of subjects. (A) is Healthy control; (B) is COPD patient; (C) is T2DM patient; (D) is COPD+T2DM patient. The percentage of positive cells is shown in each panel.
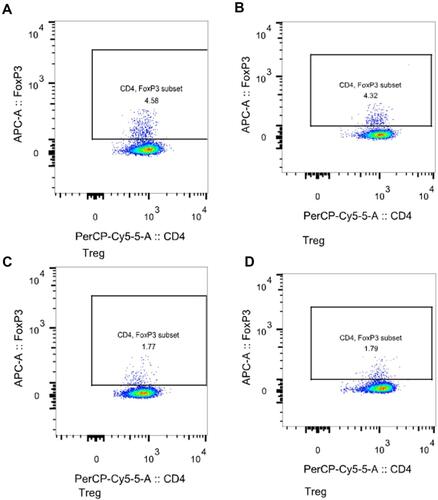
Figure 3 Imbalance of circulating Th17 and Tregs in COPD, T2DM and COPD combined with T2DM patients. (A) Comparisons of Th17 and Treg cell percentages in peripheral blood from healthy controls, COPD, T2DM and COPD combined with T2DM patients. (B) Comparisons of Th17 cell percentages in the 4 groups. (C) Comparisons of Treg cell percentages in the 4 groups. (D) Comparisons of the ratios of Th17/Treg in the 4 groups. The data are represented as the mean ± SD; a value of *P <0.05 was considered statistically significant.
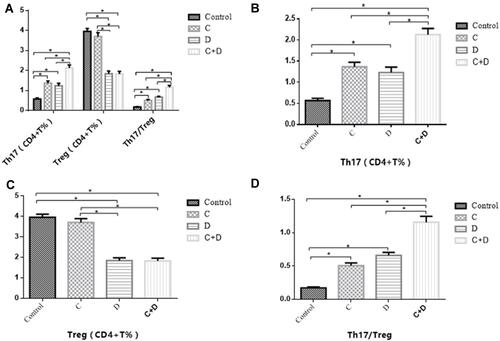
Figure 4 The relative levels of Foxp3 and RORγt mRNA transcripts to the control glyceraldehyde 3-phosphate dehydrogenase (GAPDH) in PBMCs from healthy controls, COPD, T2DM and COPD combined with T2DM patients. (A and C) Comparisons of RORγt in the 4 groups. (B and D) Comparisons of Foxp3 in the 4 groups. The data are represented as the mean ± SD; a value of **P <0.01 was considered statistically significant. COPD (C group), T2DM (D group) and COPD combined with T2DM (C+D group).
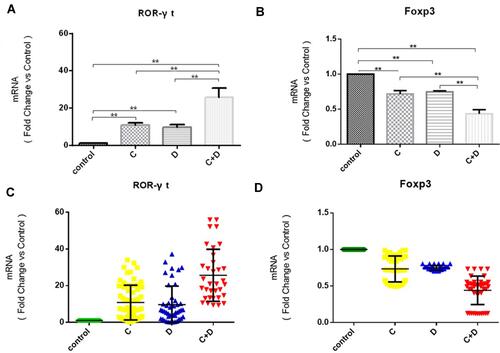
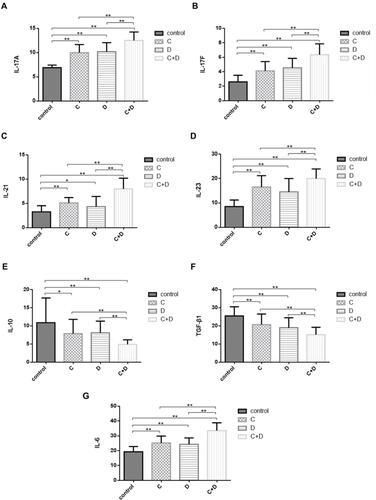
Figure 5 Disordered homeostasis of serum IL-17A, IL-17F, IL-21, IL-23, IL-10, TGF-β1 and IL-6 in COPD, T2DM and COPD combined with T2DM patients. Levels of inflammatory cytokines were quantified by ELISA in the 4 groups (A) IL-17A, (B) IL-17F, (C) IL-21, (D) IL-23, (E) IL-10, (F) TGF-β1, (G) IL-6. The data are represented as the mean ± SD; a value of *P <0.05 or **P <0.01 was considered statistically significant. COPD (C group), T2DM (D group) and COPD combined with T2DM (C+D group).