
Figures & data
Figure 1 Patient flow through the study.
Notes: Tiotropium: open-label tiotropium (two puffs 2.5 µg; once daily). Ensifentrine: double-blind study medication (via jet nebulizer with compressor; 0.375 mg, 0.75 mg, 1.5 mg, 3 mg, or placebo; twice daily). Full analysis set: all randomized patients with sufficient data collected after intake of blinded study medication to compute the pharmacodynamic parameters based on FEV1 on at least one occasion (n=413). Safety analysis set: all patients that received at least one dose of study medication (n=413). *One patient was dispensed 3mg drug dosing rather than 0.375 mg.
Abbreviations: FEV1, forced expiratory volume in 1second; n, number of patients.
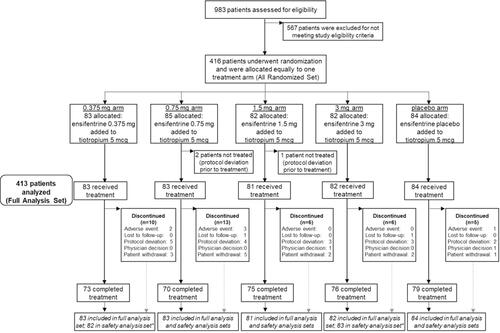
Table 1 Baseline Demographics and Disease Characteristics in the Full Analysis Set
Table 2 Baseline Patient-Reported Outcome (PRO) Scores and Rescue Medication Use for Patients with Baseline and Week 4 Values Reported in the Full Analysis Set
Table 3 Change from Baseline to Week 4 in Peak FEV1 (Over 3 Hours), Average FEV1 (0–12 Hours) and Morning Trough FEV1 in the Full Analysis Set
Figure 2 Peak FEV1 between 0 and 3 h post-dose in the full analysis set.
Notes: Mean change from baseline FEV1 and standard error of mean are shown. Data are least squares means treatment – placebo differences and 95% CI of the least squares mean difference. †P<0.05 vs placebo; ‡P<0.01 vs placebo; ¥P<0.0001 vs placebo. Least squares mean changes from baseline in the placebo ensifentrine added to tiotropium arm in the full analysis set (placebo, n=84) were 104, 110, 107, and 119 mL at Weeks 1, 2, 3 and 4, respectively. Baseline, post 2 weeks receiving tiotropium.
Abbreviations: CI, confidence interval; FEV1, forced expiratory volume in 1second; p, p-value vs placebo; placebo, placebo ensifentrine added to tiotropium.
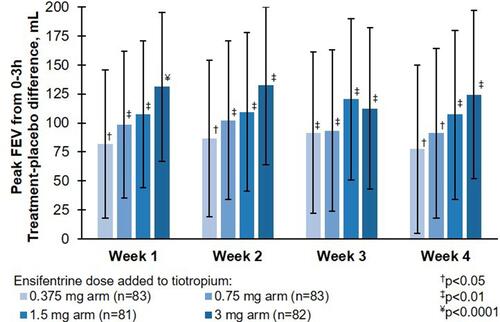
Table 4 Change from Baseline to Week 4 in SGRQ-C Total Score, E-RS™: COPD Total Score and TDI Score in the Full Analysis Set
Table 5 Proportion of Treatment Emergent Adverse Events Summary Listed by Prevalence in the Safety Analysis Set