Figures & data
Figure 1 Development of the study groups.
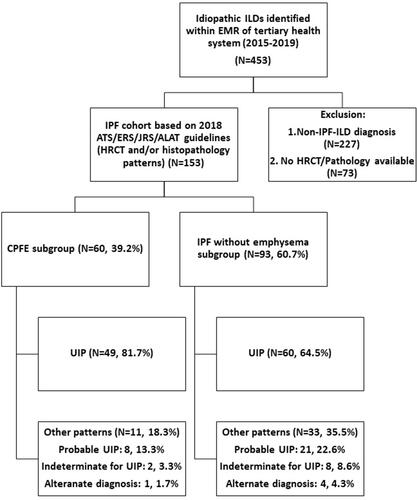
Table 1 Clinical Characteristics and Outcomes in the CPFE and IPF Without Emphysema Groups
Figure 2 Trend of pulmonary function tests between CPFE vs IPF without emphysema groups. Time 1: at the time of diagnosis; Time 2: latest during the disease course. There was no significant difference in the differences of decline in PFT data when measured at two different time frames of disease course (at time of diagnosis and the latest). (A) FEV1 and FVC % predicted at time 1 and 2 between the groups (non-significant difference). (B) DLCO % predicated at time 1 and 2 between the groups. CPFE group had significantly lower DLCO % predicted at the time 1 (38.35±15.45 vs 51.09±15.96, p = 0.001).
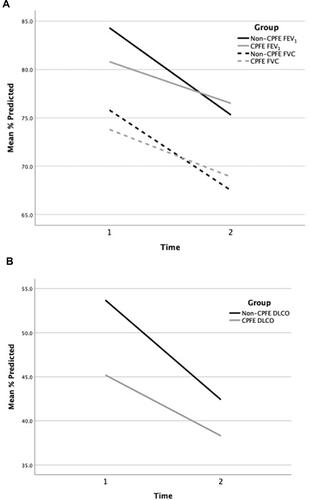
Table 2 Multivariate Logistic Regression Analysis: Predictors of CPFE
Table 3 Multivariate Logistic Regression Analysis: Predictors of Survival for Total IPF Cohort
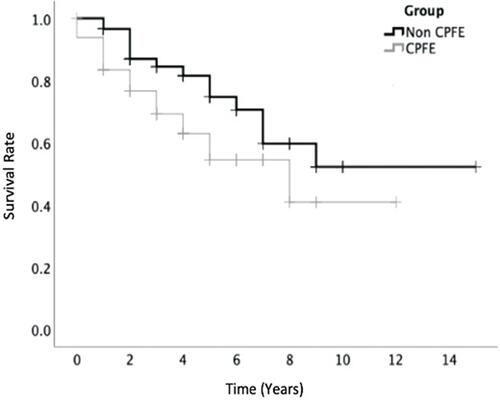
Figure 3 Kaplan–Meier survival analysis of CPFE and IPF without emphysema groups. There was a trend towards reduced survival between the groups over time since their diagnosis, however not statistically different (log-rank p = 0.076). X-axis signifies years alive since diagnosis during the study time frame and Y-axis shows survival rate. The mean years since diagnosis between the groups were 4.45±2.39 vs 4.64±3.26 (p = 0.740), respectively.