
Figures & data

Table 1 Baseline Characteristics of Participants
Table 2 Frequency and Severity of Airway Obstruction in Participants Stratified by Sex
Figure 1 Prevalence of airway obstruction in the participants stratified by age. Prevalence of airflow obstruction was relatively constant, around 7.5%, up to age 40 years, when it increased steadily to over 40% at age ≥ 71 years.
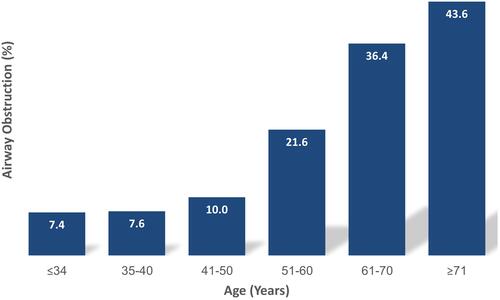
Figure 2 Prevalence of airflow obstruction in participants stratified by cigarette smoking. Prevalence of airflow obstruction remained below 10% for a cigarette consumption up to 10 p.y. From that point onwards it increased steadily to values beyond 30% for a cigarette consumption ≥ 40 p.y.
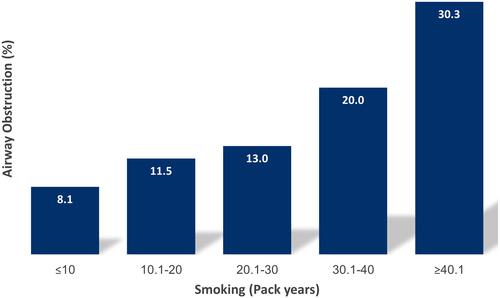
Figure 3 Prevalence of airflow obstruction in participants stratified by GOLD symptom score. Prevalence of airway obstruction increased linearly with an increase in GOLD symptom score, from 6.8% for subjects with a score of 1 pt to almost 40% for those with a score of 5 pts.
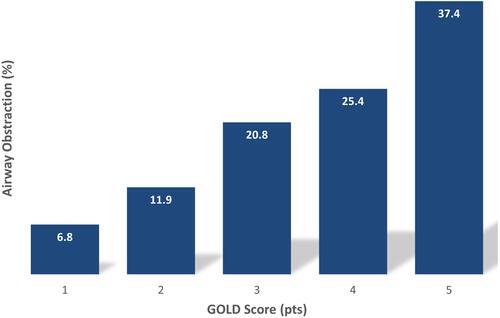
Table 3 Predictors of Airway Obstruction by Forward, Stepwise Logistic Regression Analysis
Figure 4 Logistic regression for airway obstruction according to age, BMI, cigarette smoking and GOLD score. ROC curve expressing the discrimination power of the logistic model presented in including, as dependent variable, airway obstruction (FEV1/FVC < 0.7), and as independent variables, age, BMI, cigarette smoking (p.y.) and GOLD score ≥ 3. The curve is displaced to the upper left corner, indicating good discriminating power of the model (AUC=0.763).
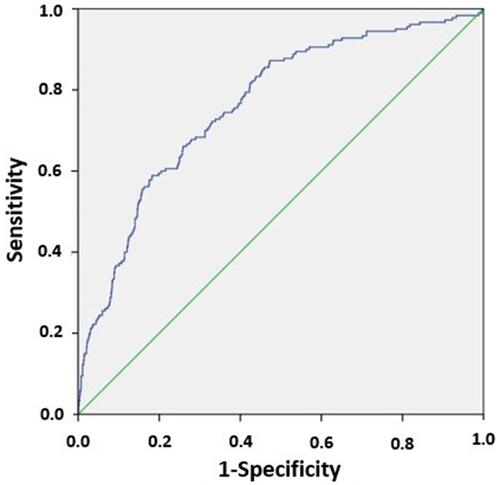
Table 4 Impact of Smoking Cessation Counselling on Smoking Habits of Participants Stratified by Gender