Figures & data
Table 1 Clinical Characteristics of the 12 COPD Patients in the State of Exacerbation
Figure 1 Flow chart of the study.
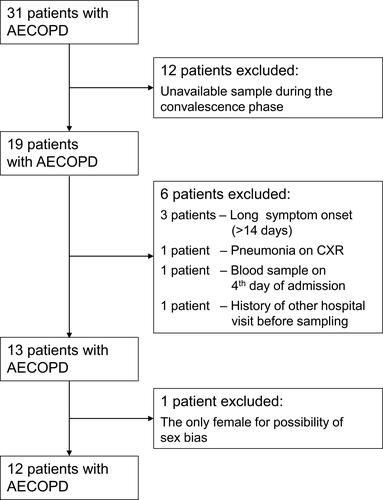
Figure 2 Proteomic analysis of the plasma samples using SWATH-MS. (A) Boxplots of normalized plasma protein abundances in the 12 pairs of COPD patient samples. (B) Reproducibility of the SWATH-MS measurements. The graph shows the CVs of the peak areas detected in triplicate analyses of each sample.
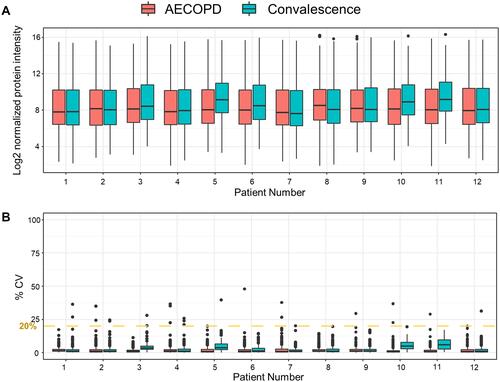
Figure 3 Principal component analysis of protein abundances in plasma samples collected from the 12 patients in the AECOPD or convalescence state.
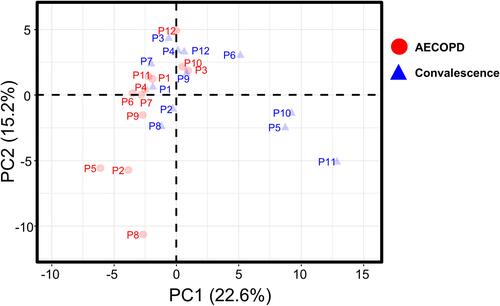
Table 2 The 29 Proteins That Were Differentially Expressed Between AECOPD and Convalescence Samples
Figure 4 Volcano plot and functional annotation of proteomic data from paired COPD plasma samples (N = 12). (A) A volcano plot showing the log2 fold-change in the abundance of each protein between the AECOPD and convalescence samples on the x-axis, and the FDR-corrected p-value (q-value) on the y-axis. Red circles show the 14 plasma proteins that were present at significantly higher levels in AECOPD samples than in convalescence samples. Blue circles show the 15 plasma proteins that were present at significantly higher levels in convalescence samples than in AECOPD samples. Gray circles represent plasma proteins that were not differentially expressed between the two groups. (B) A gene ontology (GO) analysis of the proteins that were differentially expressed between the two COPD states (FDR < 0.0001). The GO terms represent the link between a protein and a particular biological process, molecular function, or cellular component.
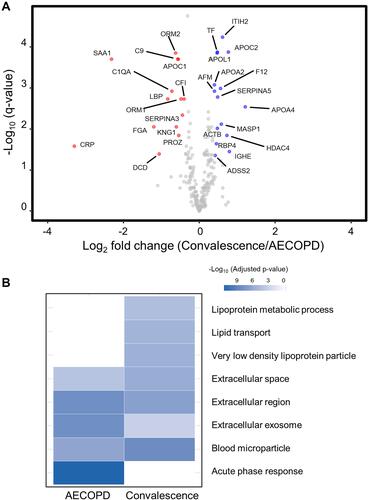
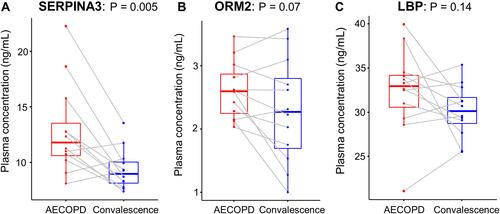
Figure 5 Boxplots of the plasma concentrations of SERPINA3 (A), ORM2 (B), and LBP (C) determined using ELISAs.