
Figures & data
Figure 1 Protocol for CT screening in Shimane, Japan.
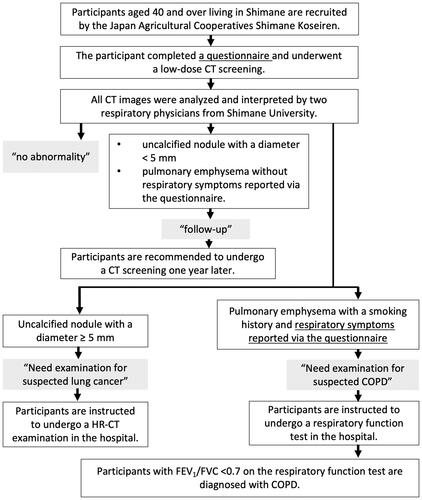
Figure 2 Questionnaire created by our department and used for CT screening in Shimane, Japan. IPAG questionnaire items represent the interview questions that are the same as in the IPAG questionnaire.
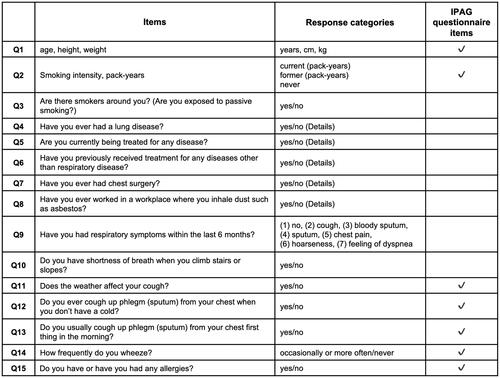
Table 1 Relationship Between Pack-Years and COPD Occurrence
Figure 3 ROC curve for pack-year (sample, n = 11,458). Area under ROC curve = 0.88588. A cut-off of 22.50 pack-year showed a sensitivity of 91.3% and a specificity of 73.0%.
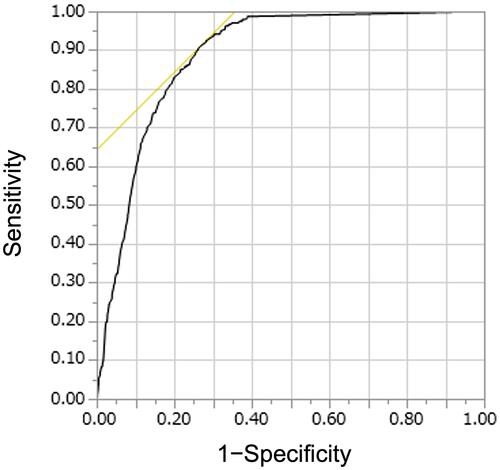
Table 2 Baseline Characteristics of the Subjects and All Participants
Figure 4 ROC curve for the COPD questionnaire of IPAG (subset sample, n = 3252). Area under ROC curve = 0.67648. A cut-off score of 23.00 showed a sensitivity of 60.4% and a specificity of 63.8%.
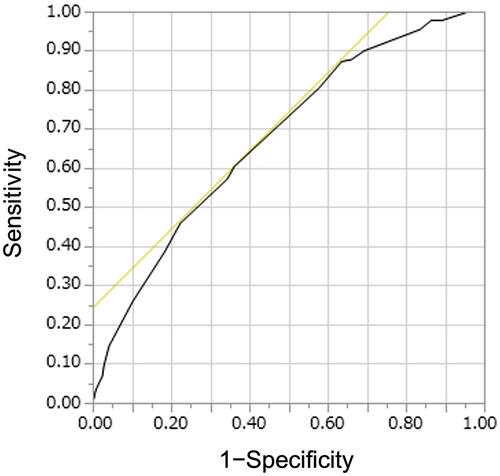
Table 3 Efficacy of the Components of the Novel Questionnaire Used to Screen for COPD in Shimane, Japan
Table 4 COPD Predicted Value Calculated Using the Logistic Regression Model Obtained in This Study. It is Assumed That Responses to the Questions “Do You Often Develop Cough?”, “Do You Often Produce Sputum?”, and “Do You Often Have a Feeling of Dyspnea?” are All “Yes”
Table 5 COPD Predicted Value Calculated Using the Logistic Regression Model Obtained in This Study. It is Assumed That Response to the Questions “Do You Often Have a Feeling of Dyspnea?”, Which Has the Highest Odds Ratio Among the Narrowed Questionnaires, is “Yes”