Figures & data
Table 1 PCR Primer Sequence Information of Mouse
Table 2 Total and Differential Cell Counts in BALF (Cells/ml)
Table 3 The Levels of Inflammatory Factors in BALF and Serum (pg/ml)
Figure 1 Detection of emphysema.
Notes: (A) Con group. (B) COPD group. (C) COPD+AE group. Hematoxylin-eosin staining revealed evidence of the degree of emphysema. (D) Detection of MLI. LPS administration increased the MLI, while 4 weeks of exercise intervention significantly decreased the MLI. The difference in MLI was significant between the Con and COPD + AE groups. #P<0.05 compared with the Con group. *P<0.05 compared with the COPD group (magnification, x100).
Abbreviation: MLI, mean linear intercept.
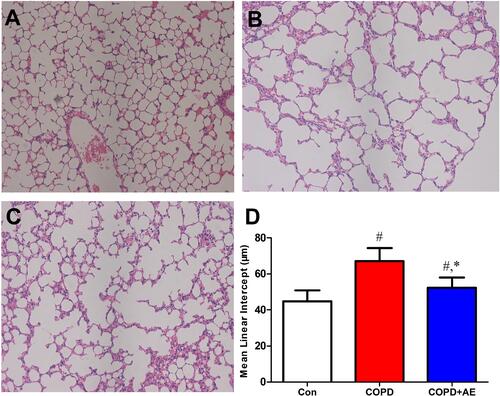
Figure 2 Detection of pulmonary fibrosis.
Notes: (A) Con group. (B) COPD group. (C) COPD+AE group. (D) Detection of the fibrotic score. Mason staining revealed evidence of the degree of pulmonary fibrosis. The fibrotic score increased after LPS administration, while exercise administration decreased fibrotic score. #P<0.05 compared with the Con group. *P<0.05 compared with the COPD group (magnification, x200).
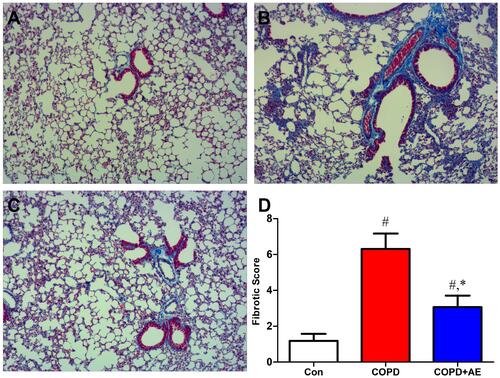
Figure 3 Detection of airway fibrosis.
Notes: (A) Con group. (B) COPD group. (C) COPD+AE group. (D) Detection of collagen fiber deposition in the airway wall. The airway collagen increased after LPS administration, while exercise administration decreased fibrotic score. The results were expressed as μm2 of collagen fibers per μm2 of tissue area. #P<0.05 compared with the Con group. *P<0.05 compared with the COPD group (magnification, x40).
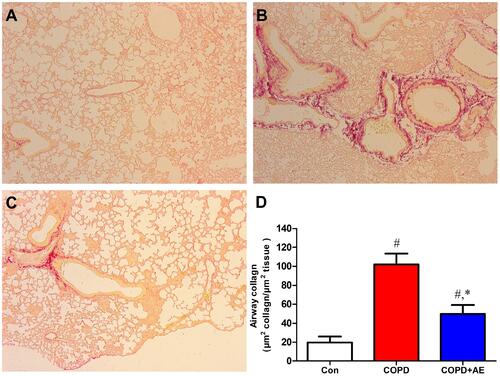
Figure 4 Detection of gene expression levels in lung tissue.
Notes: The gene expression levels of pro-inflammatory factors IL-1β (A), IL-17 (C), TNF-α (D), and CXCL1 (E) and profibrotic factors TGF-β (F) and MMP-9 (G) and decreased anti-inflammatory factor IL-10 (B) and lung-protective factor sirt1 (H) were detected. #P<0.05 compared with the Con group. *P<0.05 compared with the COPD group.
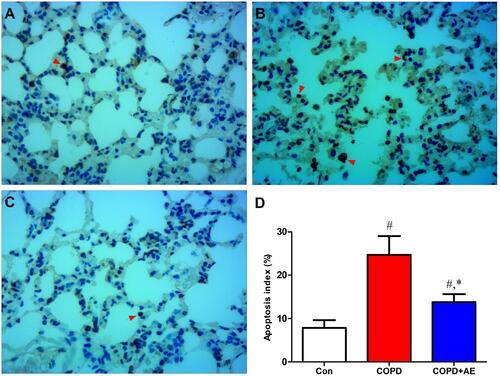
Figure 5 Detection of cell apoptosis.
Notes: (A) Con group. (B) COPD group. (C) COPD+AE group. (D) Detection of apoptosis index. TUNEL staining revealed evidence of cell apoptosis in the lung. LPS administration increased the number of apoptotic cells (red arrow) and apoptosis index. 4 weeks of exercise intervention decreased the number of apoptotic cells and apoptosis index in COPD mice. #P<0.05 compared with the Con group. *P<0.05 compared with the COPD group (magnification, x200).
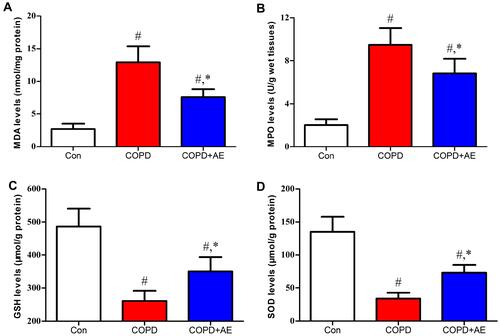
Figure 6 Detection of oxidative stress injury.
Notes: The levels of MDA (A), MPO (B), GSH (C), and SOD (D) as indicators of oxidative stress injury were detected. LPS administration increased the levels of MDA and MPO and decreased the levels of SOD and GSH. 4 weeks of exercise intervention decreased the levels of MDA and MPO and increased the levels of SOD and GSH in mice with COPD. #P<0.05 compared with the Con group. *P<0.05 compared with the COPD group.
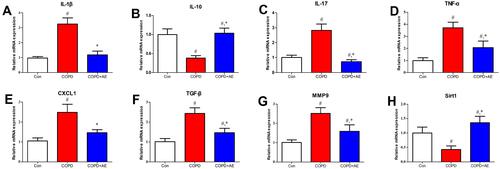
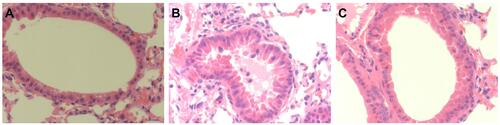
Figure 7 Detection of bronchial mucus cell hyperplasia and bronchoconstriction.
Notes: (A) Con group. (B) COPD group. (C) COPD+AE group. LPS administration led to severe bronchial mucus cell hyperplasia and bronchoconstriction, while 4 weeks of AE improved bronchial mucus cell hyperplasia and bronchoconstriction (magnification, x400).