
Figures & data
Table 1 The Distribution of Baseline Demographic and Clinical Characteristics in Different Groups (N = 993)
Figure 1 Flow chart of study inclusion. Groups A to D were categories according to GOLD 2017 guidelines.
Abbreviations: COPD, chronic obstructive pulmonary disease; GOLD, Global Initiative for Chronic Obstructive Lung Disease; PFT, pulmonary function test.
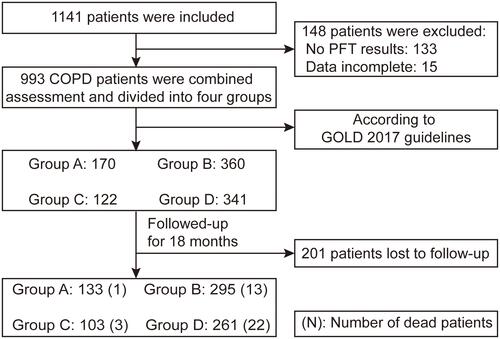
Table 2 Characteristics of Pulmonary Function in Different Groups (N = 993)
Table 3 Differences in Demographic and Clinical Characteristics for Different Severity of Airflow Limitation in Groups A, B, C and D (N = 993)
Table 4 Future Exacerbations and Mortality in Groups A, B, C and D After 18 Months of Follow-Up (N = 792)
Table 5 Future Exacerbations and Mortality for Different Severity of Airflow Limitation in Groups A, B, C and D After 18 Months of Follow-Up (N=792)