Figures & data
Figure 1 mRNA transcriptomic alterations in induced sputum from stable COPD patients (Study A). Transcriptomic changes in induced sputum taken from stable COPD patients dosed for 14 days with nemiralisib show a partial clustering by treatment (Panel A). Unbiased pathway analysis highlighted nemiralisib-evoked alterations in neutrophil phenotype and bacterial infection response genes (Panels B and C, left), which were not observed in the samples taken 7 days apart prior to randomization (Panels B and C, right).
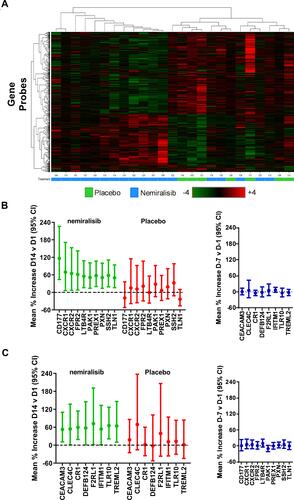
Table 1 Summary of Number of Genes Reaching Cut Offs (Fold Change >1.5 and P<0.05) from the Predefined Gene List, and Entire Gene Array in Sputum and Blood
Figure 2 mRNA transcriptomic alterations in induced sputum from AECOPD patients (Study B). Transcriptomic changes in induced sputum taken from acutely exacerbating COPD patients. Of the predefined neutrophil-related genes a small number were altered in both the nemiralisib and placebo-treated groups (Panel A). The entire unbiased gene array output also showed a similar number of genes changing in the nemiralisib and placebo-treated groups when comparing both day 12 or day 84 to the screening time point (Panel A, SCN v D12). There was a significant overlap in the genes changing between screening and day 12 in the nemiralisib and placebo-treated groups at day 12 and day 84, with almost all genes changing in the same direction (Panel B).
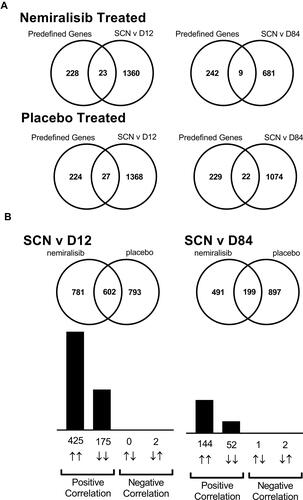
Figure 3 Inflammatory biomarkers in induced sputum from AECOPD patients (Study B) Sputum and circulating biomarkers measured were also not impacted by treatment with nemiralisib. Circulating levels of CRP decreased (Panel A, left), as did neutrophil count (Panel A, right), presented as mean (95% CI) at baseline, Day 12, Day 28, Day 56, Day 84 and at follow-up. Total sputum cell count and the inflammatory cytokines IL-8, IL-6 and TNFα were also not inhibited following treatment with nemiralisib (Panel B), presented as geometric mean (95% CI) at baseline, Day 12, Day 28 and Day 84.
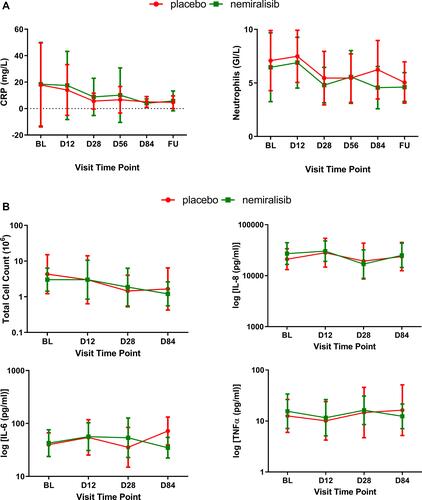
Table 2 Alterations in Functional Respiratory Imaging Endpoints Measured Using HRCT
Figure 4 Summary of statistical analysis of FEV1 and FVC in AECOPD patients (Study B). Treatment with nemiralisib showed an improvement in FEV1 and FVC at all time points. Panel A shows adjusted median change from baseline in FEV1 (95% Cr I), and Panel B shows adjusted median change from baseline in FVC (95% Cr I) measured at clinical visits at baseline, Day 12, Day 28, Day 56 and Day 84. Data presented as adjusted median ± 95% Credible Intervals.
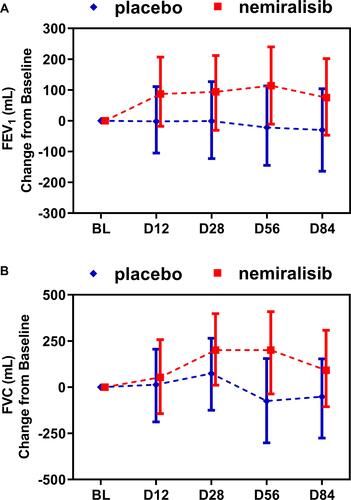
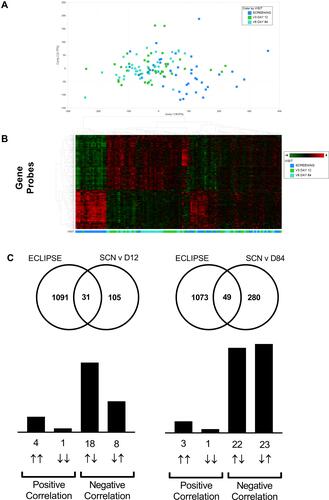
Figure 5 Lung transcriptomics during exacerbation recovery (Study B). Combined sputum transcriptomic data shows partial clustering by time point (Panels A and B). Unbiased overlay analysis showed a highly significant overlap with data from ECLIPSE .Citation27,Citation30 The degree of overlap and gene directionality for the matching genes are displayed in (Panel C).
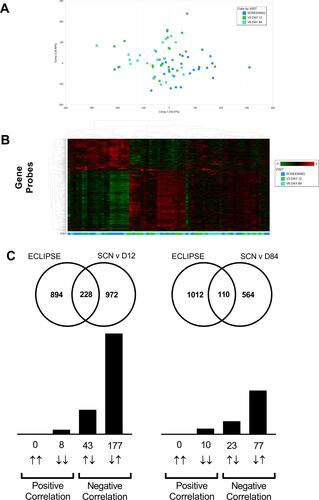
Figure 6 Blood transcriptomics during exacerbation recovery (Study B). Combined blood transcriptomic data shows partial clustering by time point (Panels A and B). Unbiased overlay analysis showed a highly significant overlap with data from ECLIPSE.27,30 The degree of overlap and gene directionality for the matching genes are displayed in (Panel C).