
Figures & data
Table 1 Baseline Demographic and Clinical Characteristics
Figure 1 Patient flow through the study.
Notes: aIncludes participants not randomized due to sponsor decision to stop the study; bProtocol stopping criteria: clinically significant lab value; pneumonia; Qtc withdrawal criteria.
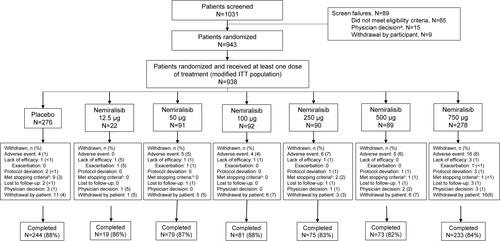
Table 2 Change from Baseline in Trough FEV1 (L) at Day 84
Table 3 Subsequent Moderate/Severe Exacerbation Rate During Treatment
Table 4 Proportion of Responders in Patient-Reported Outcomes (EXACT-Defined Recovery, CAT Total Score and SGRQ Total Score) and EXACT-Defined Time to Recovery
Table 5 Summary of Most Commonly Reported Adverse Events (AE) and AEs Assessed as Drug-Related