198
Views
3
CrossRef citations to date
0
Altmetric
Original Research

Chest Dynamic-Ventilatory Digital Radiography in Chronic Obstructive or Restrictive Lung Disease

ORCID Icon, , , , , , , , , , , , & show all
Pages 1393-1399 | Published online: 18 May 2021

Figures & data

Table 1 Characteristics of Participants Based on Ventilatory Disorders

Figure 1 Obstructive disorder is defined as FEV1/FVC < 0.7. The degrees of severity of airflow limitation (AL) are defined as follows: mild airflow limitation, FEV1 ≥ 80% predicted; moderate airflow limitation, 50% ≤ FEV1 < 80% predicted; and severe airflow limitation, FEV1 < 50% predicted. The restrictive pattern is defined as FVC < 80% predicted. The severity of restrictive disease (RD) is defined as follows: moderate restrictive disease, 65% ≤ FVC < 80% predicted; severe restrictive disease, FVC < 65% predicted. Participants with both FVC ≥ 80% predicted and FEV1/FVC ≥ 0.7 were included in the control group. (A) Distribution of lung area_in/height in each type of ventilatory disorder. (B) Distribution of tracheal diameter change in each type of ventilatory disorder. Distribution of tracheal narrowing rate in each type of ventilatory disorder. (C) Distribution of diaphragmatic motion in each type of ventilatory disorder. (D) Distribution of lung area change rate in each type of ventilatory disorder. Lung area change rate represents the rate of change in the lung area due to respiratory motions. Lung area change rate: (lung area_ex – lung area_in)/lung area_in. Lung area_in: lung area at the time of maximal inspiration. Lung area_ex: lung area at the time of maximal expiration. *P < 0.05 compared to control by Mann–Whitney U-test.

Figure 1 Obstructive disorder is defined as FEV1/FVC < 0.7. The degrees of severity of airflow limitation (AL) are defined as follows: mild airflow limitation, FEV1 ≥ 80% predicted; moderate airflow limitation, 50% ≤ FEV1 < 80% predicted; and severe airflow limitation, FEV1 < 50% predicted. The restrictive pattern is defined as FVC < 80% predicted. The severity of restrictive disease (RD) is defined as follows: moderate restrictive disease, 65% ≤ FVC < 80% predicted; severe restrictive disease, FVC < 65% predicted. Participants with both FVC ≥ 80% predicted and FEV1/FVC ≥ 0.7 were included in the control group. (A) Distribution of lung area_in/height in each type of ventilatory disorder. (B) Distribution of tracheal diameter change in each type of ventilatory disorder. Distribution of tracheal narrowing rate in each type of ventilatory disorder. (C) Distribution of diaphragmatic motion in each type of ventilatory disorder. (D) Distribution of lung area change rate in each type of ventilatory disorder. Lung area change rate represents the rate of change in the lung area due to respiratory motions. Lung area change rate: (lung area_ex – lung area_in)/lung area_in. Lung area_in: lung area at the time of maximal inspiration. Lung area_ex: lung area at the time of maximal expiration. *P < 0.05 compared to control by Mann–Whitney U-test.

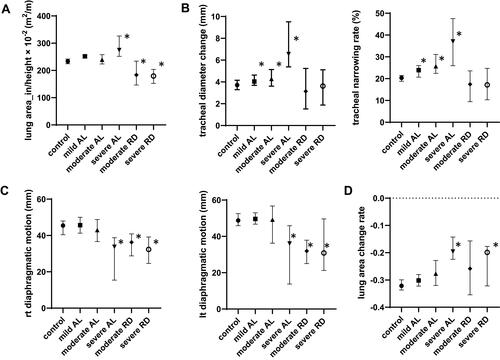
Table 2 AUC, Cut-Off Value, Sensitivity, Specificity for Ventilatory Disorder