Figures & data
Table 1 Baseline characteristics of 44 patients treated with InterVapor
Figure 1 Change from baseline in treated upper lobe and ipsilateral lower lobe volumes 6 and 12 months after InterVapor treatment.
Abbreviations: UL, upper lobe; LL, lower lobe; mo, months.
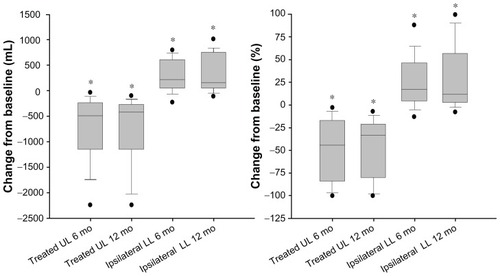
Table 2 Change from baseline at 6 and 12 months in pulmonary function (absolute change and change in percent of predicted normal) following InterVapor
Figure 2 Change from baseline in FEV1 (mL and % predicted) 6 and 12 months after InterVapor treatment.
Notes: *P < 0.05 vs baseline; †P < 0.05 12 months vs 6 months.
Abbreviation: FEV1, forced expiratory volume in 1 second.
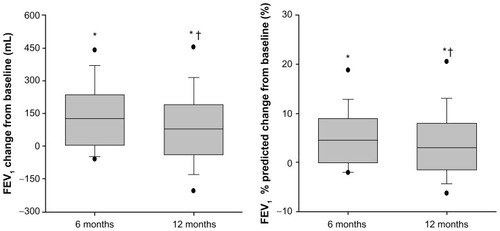
Figure 3 Change from baseline in RV (mL and % predicted) 6 and 12 months after InterVapor treatment.
Abbreviation: RV, residual volume.
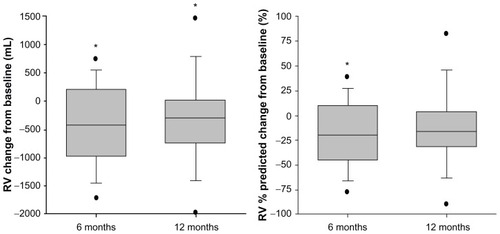
Table 3 SGRQ total score and domains at baseline and change from baseline at 6 and 12 months following InterVapor
Table 4 Changes in efficacy outcomes at 6 and 12 months according to GOLD stage III and GOLD stage IV disease severity
Table 5 Changes in efficacy outcomes at 6 and 12 months according to HI > 1.6 and HI < 1.6