Figures & data
Table 1 Characteristics of All Participants
Figure 1 Correlation of FEV1 measured by the conventional spirometry with FEV1 measured by the handheld expiratory flowmeter. (A) Relationship between FEV1 measured by spirometry and FEV1 measured by the handheld expiratory flowmeter in total group (r1=0.889, P<0.001), non-COPD group (r2=0.869, P<0.001) and COPD group (r3=0.907, P<0.001). (B) Relationship between FEV1 measured by spirometry and the handheld expiratory flowmeter in the groups of GOLD stage I (rI=0.810, P<0.001), stage II (rII=0.802, P<0.001), stage III (rIII=0.637, P<0.001) and stage IV (rIV=0.844,P<0.001). (C) Bland–Altman graph of FEV1 measured by spirometry and the handheld expiratory flowmeter. 4.5% (67/1487) plots were out of the 95%LoA(−0.445to 0.816L).
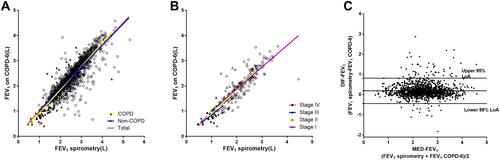
Figure 2 Correlation of FVC measured by the conventional spirometry with FEV6 measured by the handheld expiratory flowmeter. (A) Relationship between FVC measured by spirometry and FEV6 measured by the handheld expiratory flowmeter in total group (r1=0.835, P<0.001), non-COPD group (r2=0.865, P<0.001) and COPD group (r3=0.807, P<0.001). (B) Relationship between FVC measured by spirometry and FEV6 measured by the handheld expiratory flowmeter in groups of GOLD stage I (rI=0.737, P<0.001), stage II (rII=0.724, P<0.001), stage III (rIII=0.574, P=0.0014) and stage IV (rIV=0.615, P=0.269). (C) Bland–Altman graph of FVC by spirometry and FEV6 by the handheld expiratory flowmeter. 5.2% (77/1487) plots were out of the 95%LoA(0.514–1.297L).
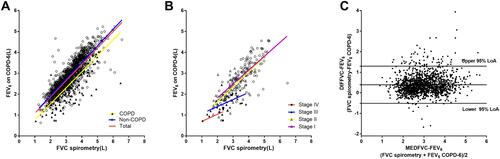
Figure 3 Correlation of FEV1/FVC measured by the conventional spirometry with FEV1/FEV6 measured by the handheld expiratory flowmeter. (A) Relationship between FEV1/FVC measured by spirometry and FEV1/FEV6 measured by the handheld expiratory flowmeter in total group (r1=0.647, P<0.001), non-COPD group (r2=0.343, P<0.001) and COPD group (r3=0.686, P<0.001). (B) Relationship between FEV1/FVC measured by spirometry and FEV6/FVC measured by the handheld expiratory flowmeter in groups of GOLD stage I (rI=0.197, P<0.044), stage II (rII=0.641, P<0.001), stage III (rIII=0.715, P<0.001) and stage IV (rIV=0.784, P=0.117). (C) Bland–Altman graph of FVC by spirometry and FEV6 by the handheld expiratory flowmeter.
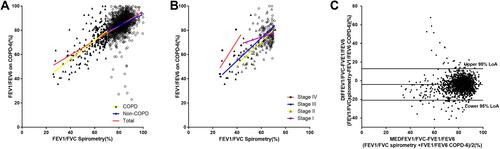
Table 2 The Measures on Sensitivity and Specificity at Different Cut-Off Points of FEV1/FEV6
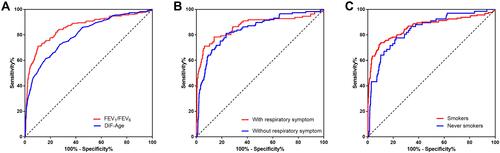
Figure 4 Area under ROC curves for FEV1/FEV6 measured by the handheld expiratory flowmeter. (A) FEV1/FEV6 by the handheld expiratory flowmeter and DIF-Age(“lung age” by the handheld expiratory flowmeter–actual age) to identify airflow obstruction.(B) FEV1/FEV6 by the handheld expiratory flowmeter to identify airflow obstruction in the population with respiratory symptoms and the population without respiratory symptom. (C) FEV1/FEV6 by the handheld expiratory flowmeter to identify airflow obstruction in the smokers (including current smokers and ex-smokers) and never-smokers. Using post-bronchodilators FEV1/FVC <70% as a “gold standard” for determination of airflow obstruction.