
Figures & data
Table 1 Baseline and Laboratory Characteristics of the Hospitalized COPD Population (n=228, 10.8%) Classified According to Presence (COPD+) or Absence (COPD–) of COVID-19 Infection
Figure 1 (A) Flow chart of the studied population. (B) Kaplan–Meier survival analysis of whole COVID-19 population in relation to the presence or absence of COPD as comorbidity.
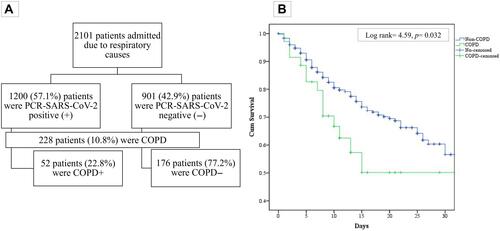
Table 2 Multivariate Logistic Analysis of the Predictors of Mortality Among Whole COPD Population